
估算 CPU 和 GPU 帧处理时间(帧时间)对于了解应用性能和定位瓶颈至关重要。使用 AGI 分析应用时,系统分析器会提供可用于估算帧时间的跟踪数据。
CPU 时间
在 AGI 中,您可以在系统配置文件的 CPU 轨迹中查看总 CPU 帧时间和活跃 CPU 帧时间。
总 CPU 时间
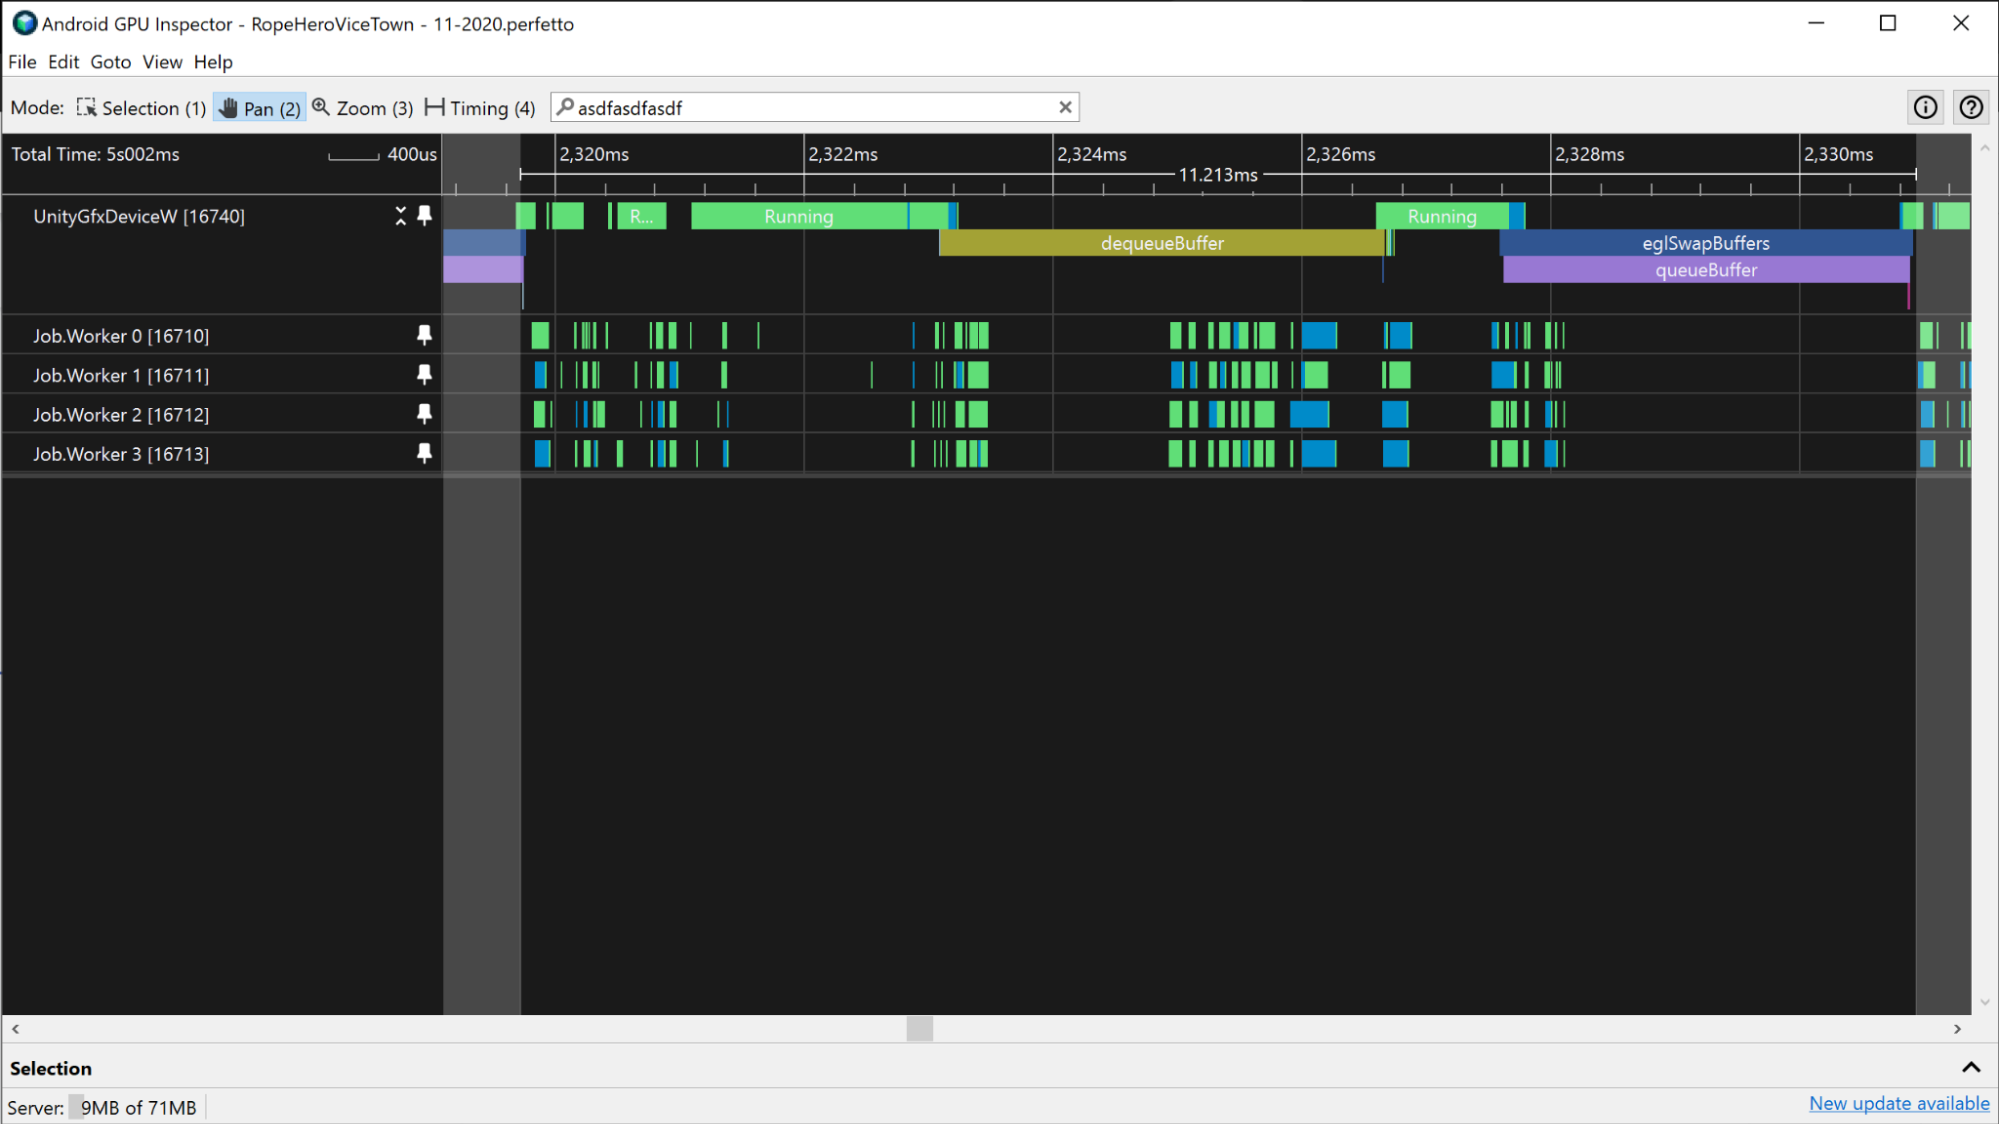
要衡量花费的总 CPU 时间,请选择时间范围,该范围包括连续帧提交事件之间的时间。帧提交事件包括 eglSwapBuffers(适用于 OpenGL)和 vkQueuePresentKHR(适用于 Vulkan)。
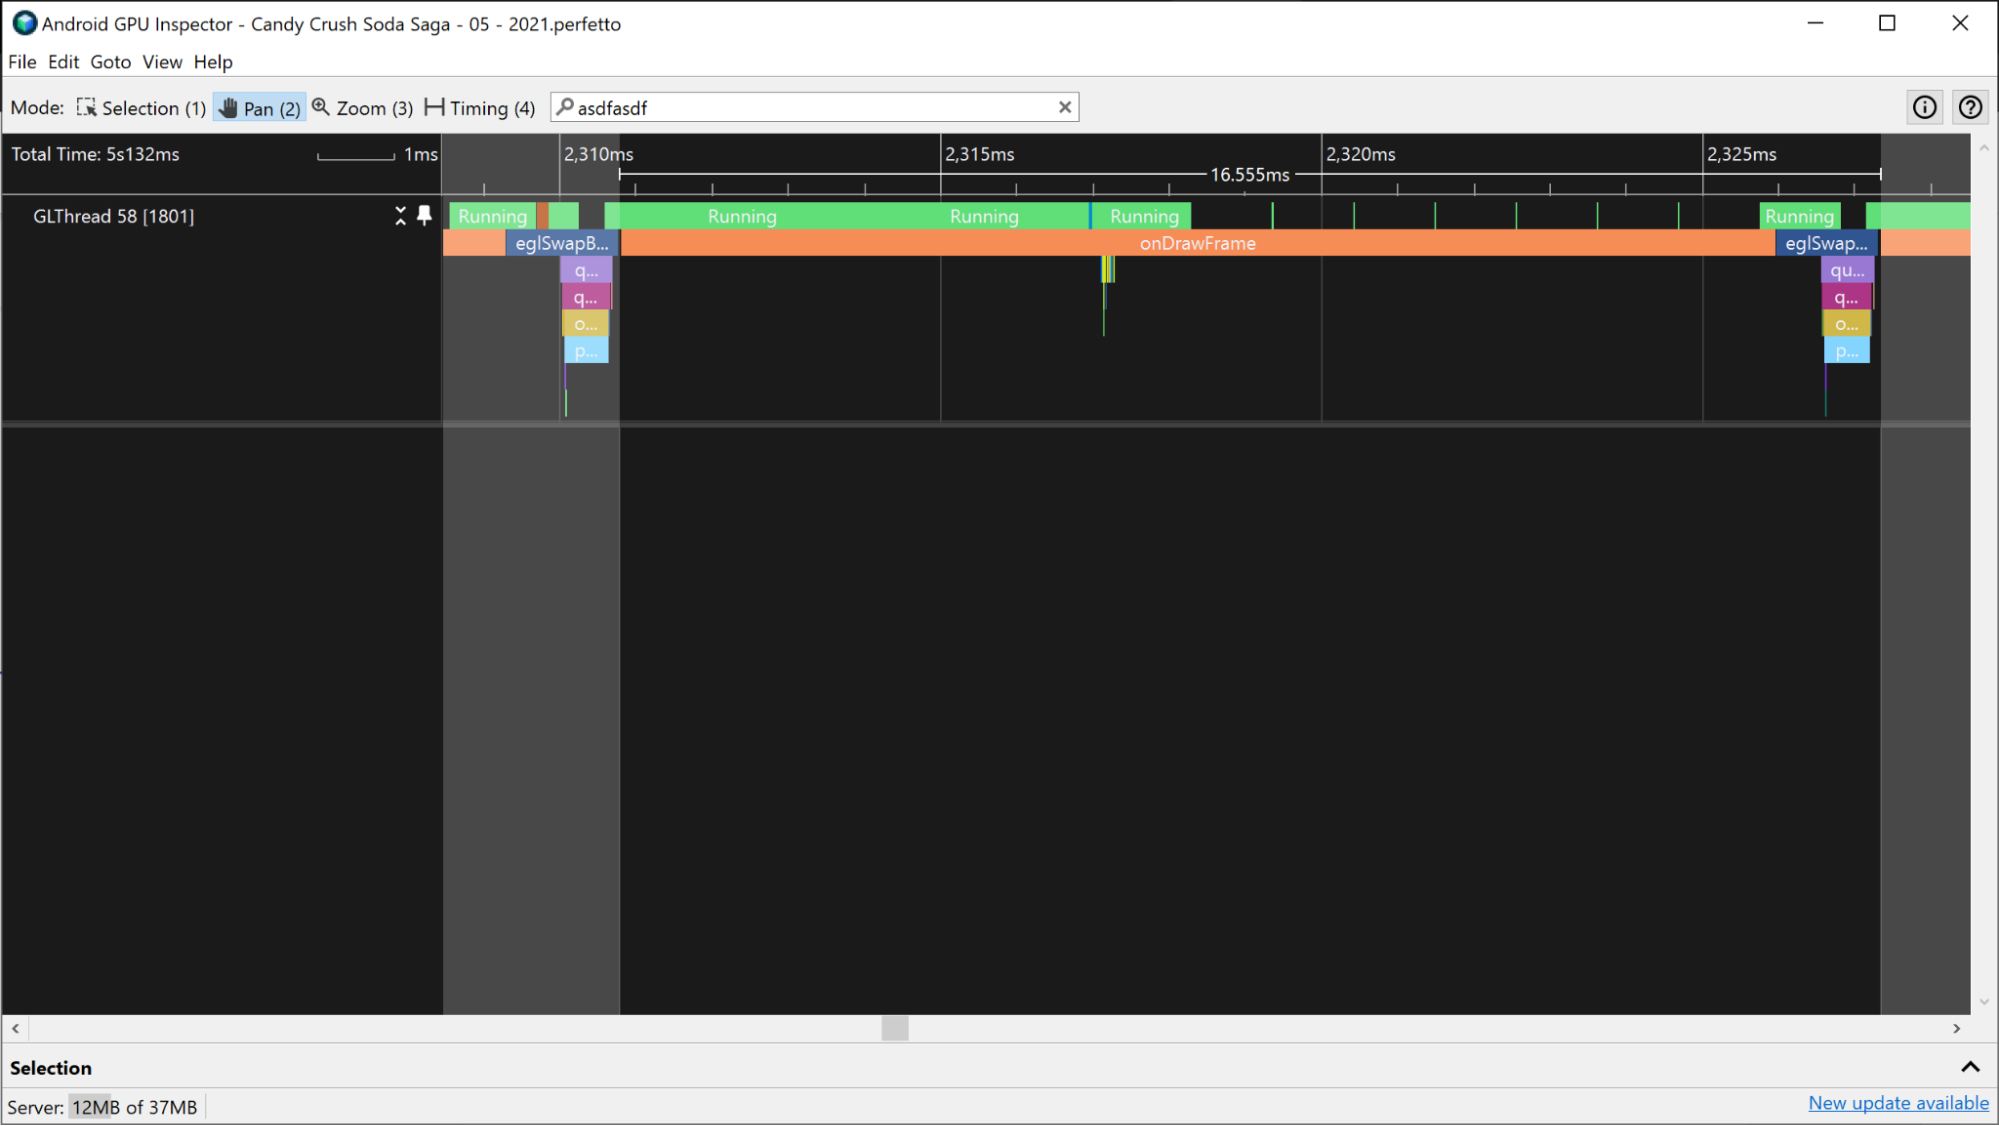
eglSwapBuffer 事件之间的时间。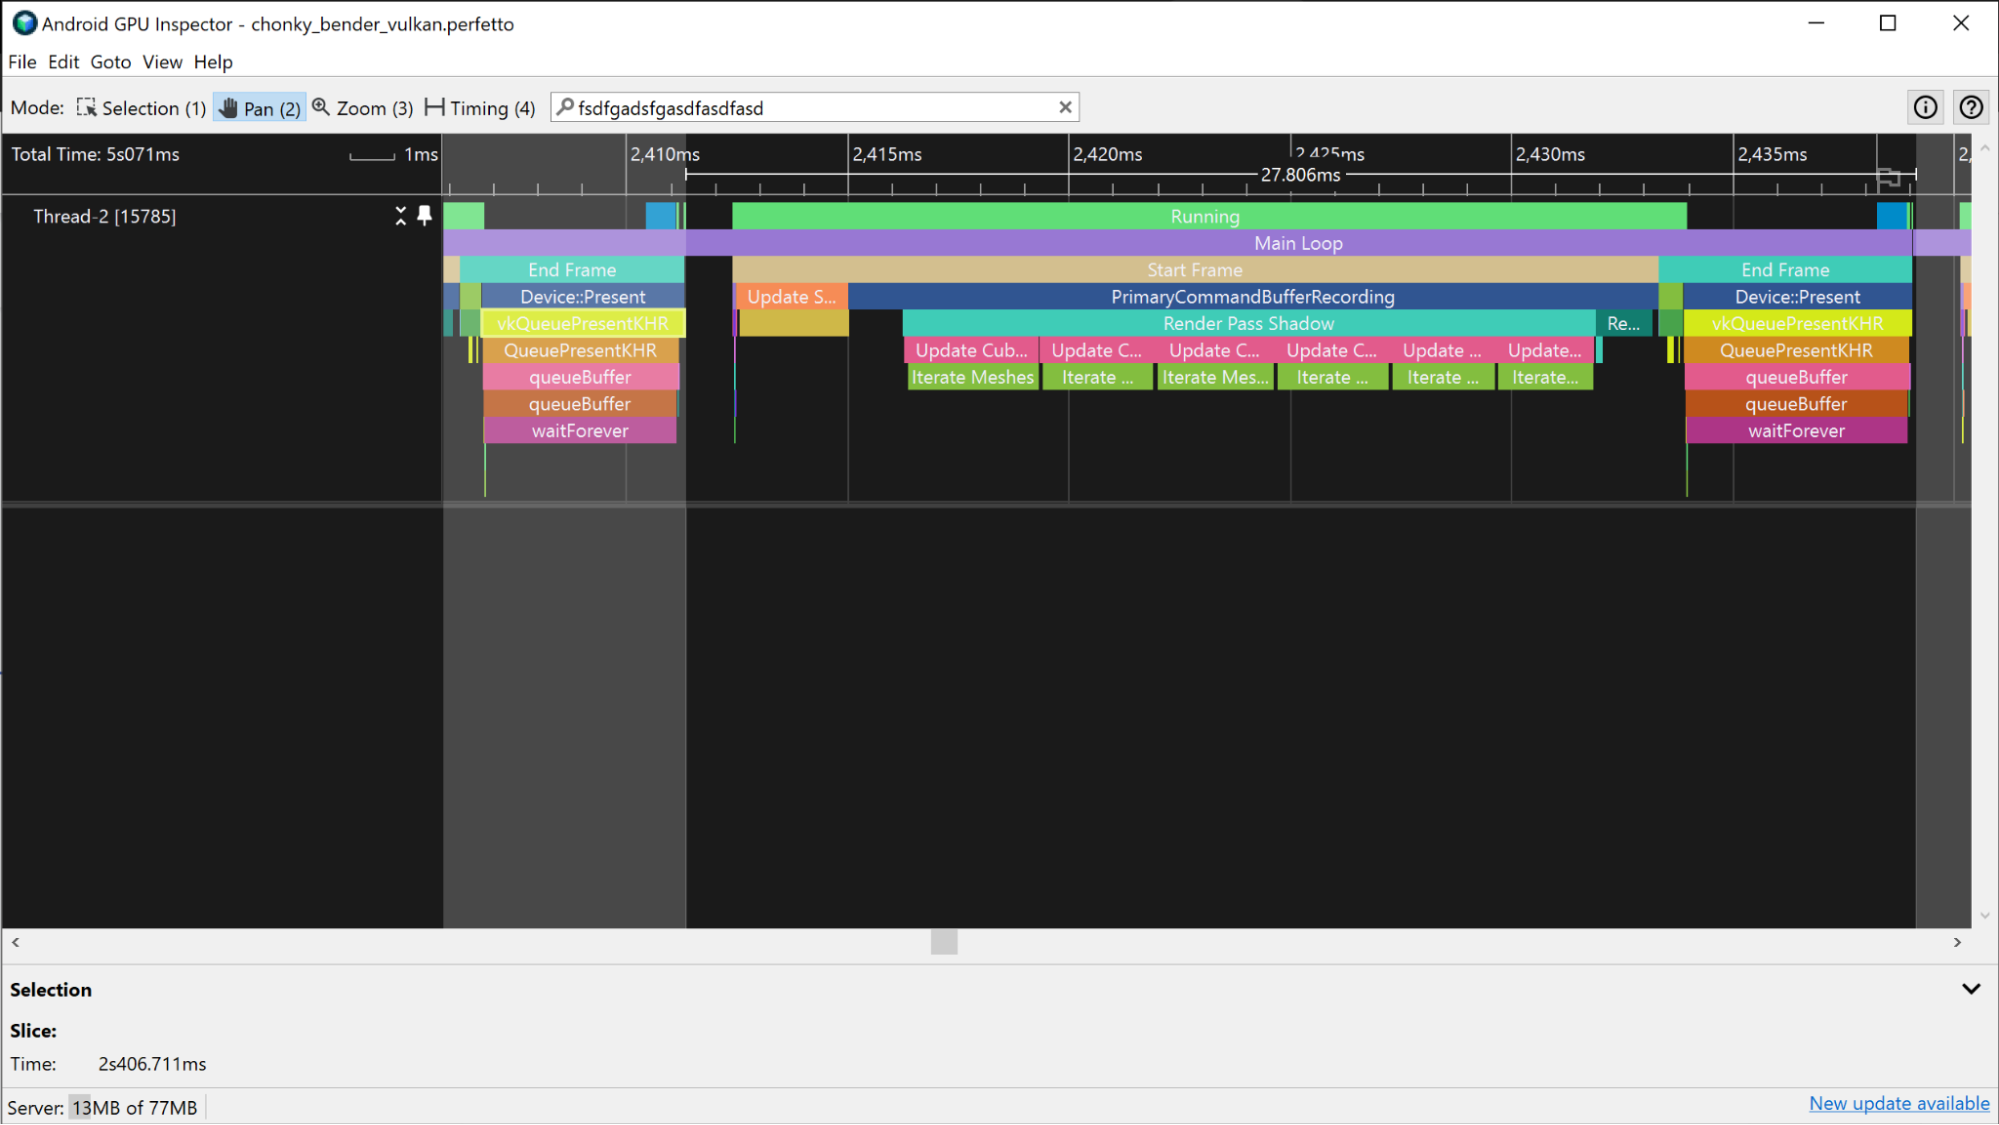
vkQueuePresentKHR 事件之间的时间。此测量值是总 CPU 时间的估算值,但不一定代表活跃 CPU 时间。例如,在受 GPU 限制的应用中,CPU 可能会等待 GPU 完成其工作后才提交新帧。这通常发生在 dequeueBuffer、eglSwapBuffer(适用于 OpenGL)或 vkQueuePresent(适用于 Vulkan)事件占用大量 CPU 时间时。等待时间包含在总 CPU 时间中,但不包含在活跃 CPU 时间中。
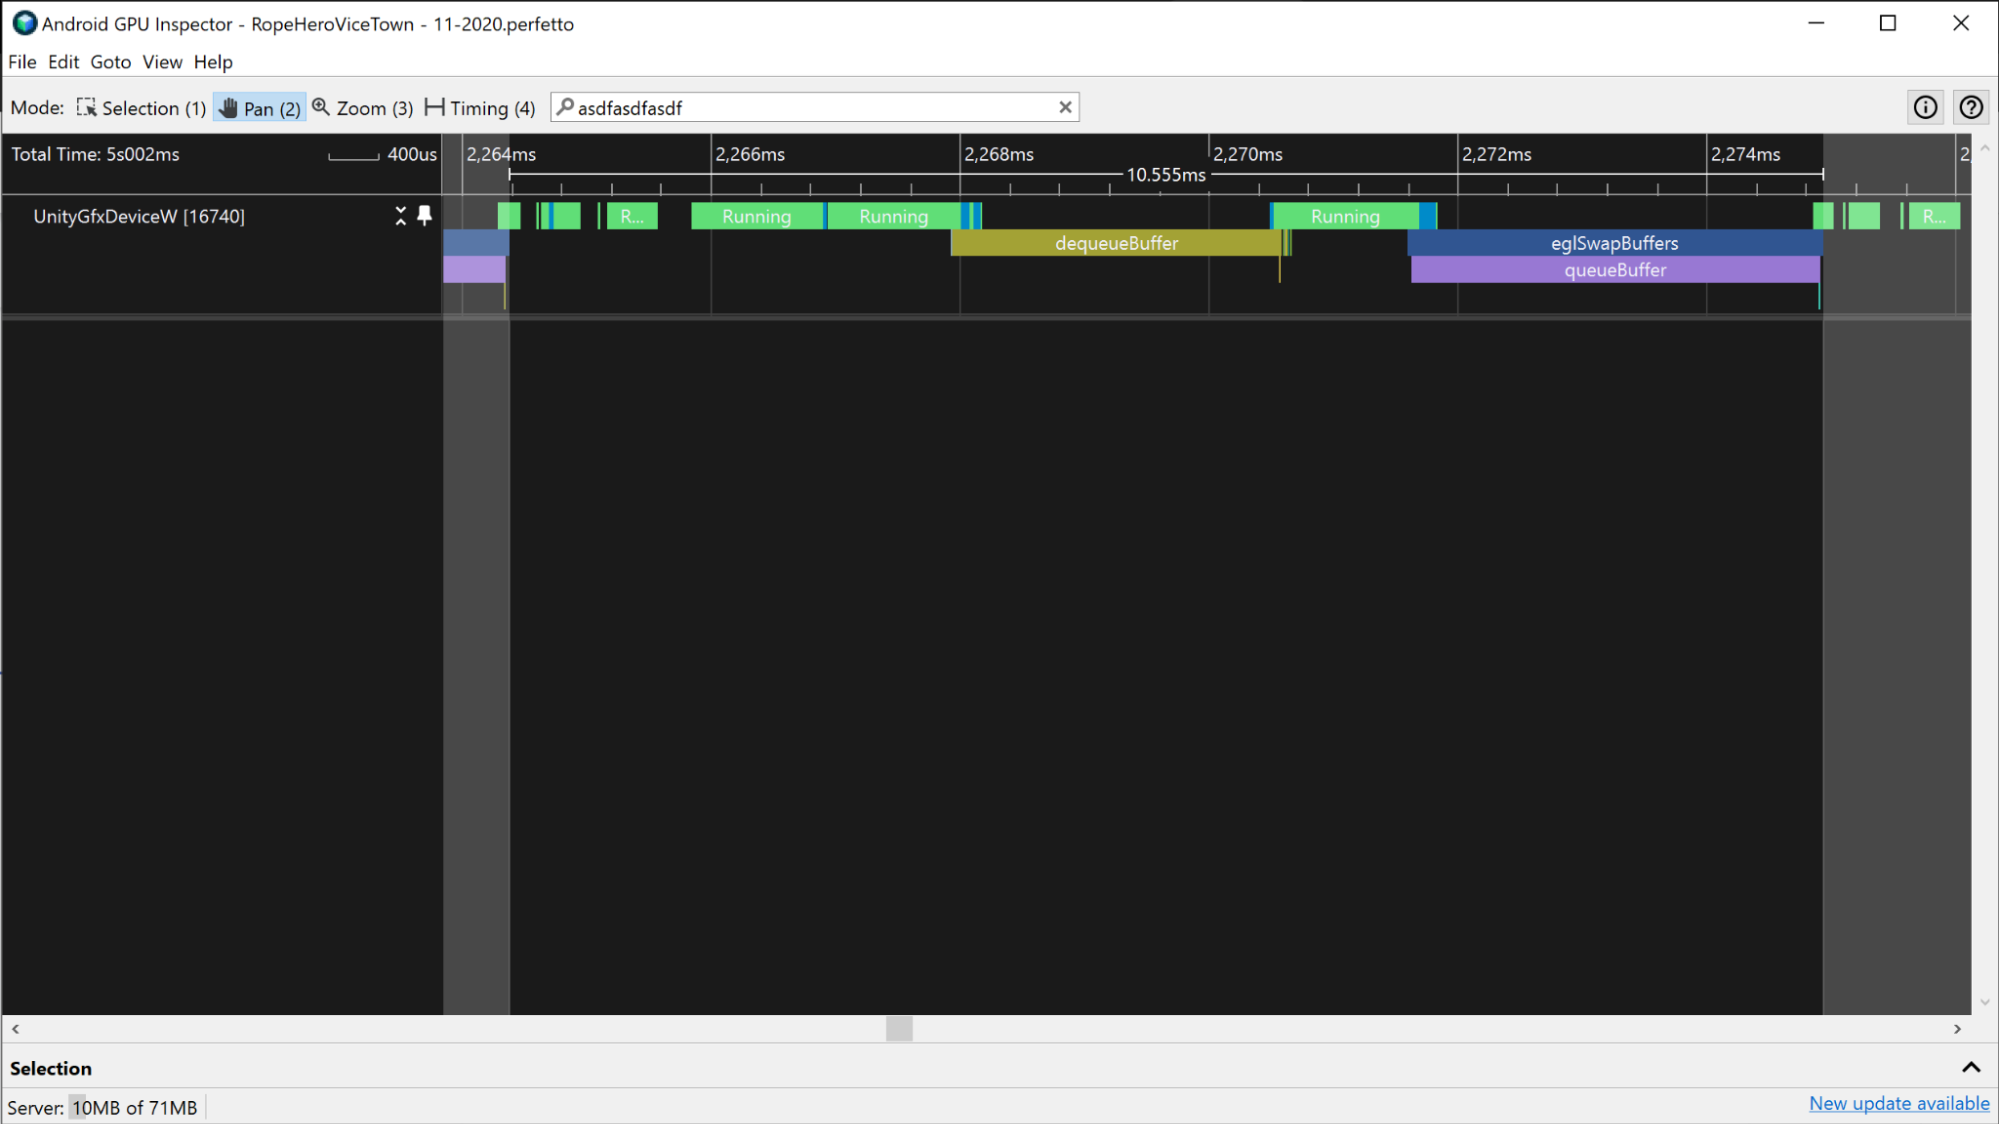
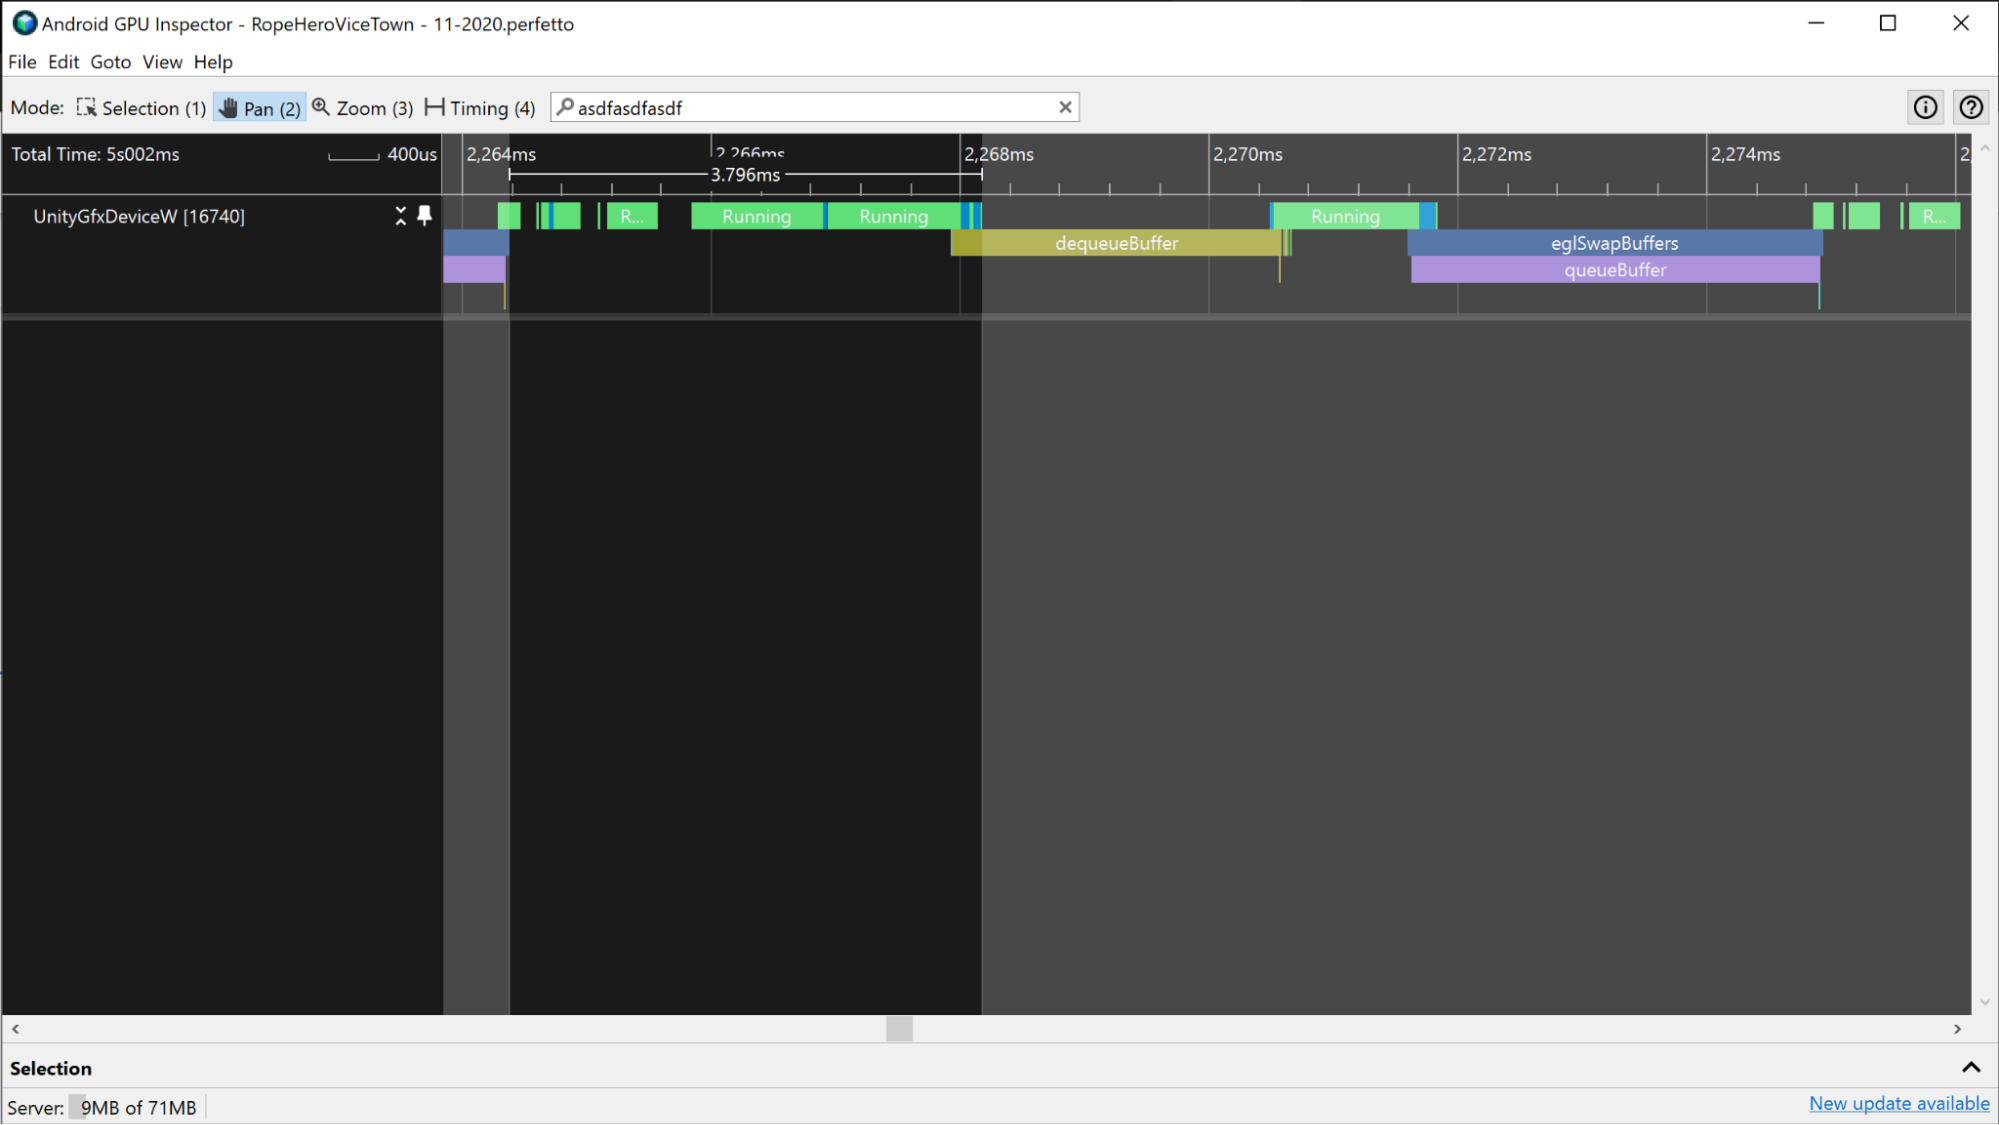
dequeueBuffer 和 eglSwapBuffer 事件期间 CPU 大量空闲。活跃 CPU 时间
活跃 CPU 时间确定 CPU 在何时运行应用代码且不处于空闲状态。
要衡量活跃 CPU 时间,请查看 CPU 事件正上方的“运行中”切片。计算两个帧提交事件之间处于“运行中”状态的所有跟踪部分。确保您包含工作线程。
衡量活跃 CPU 时间的另一种方法是查看 CPU 轨迹中的应用切片。这些切片指示 CPU 运行的时间,并且它们与“运行中”切片相对应。
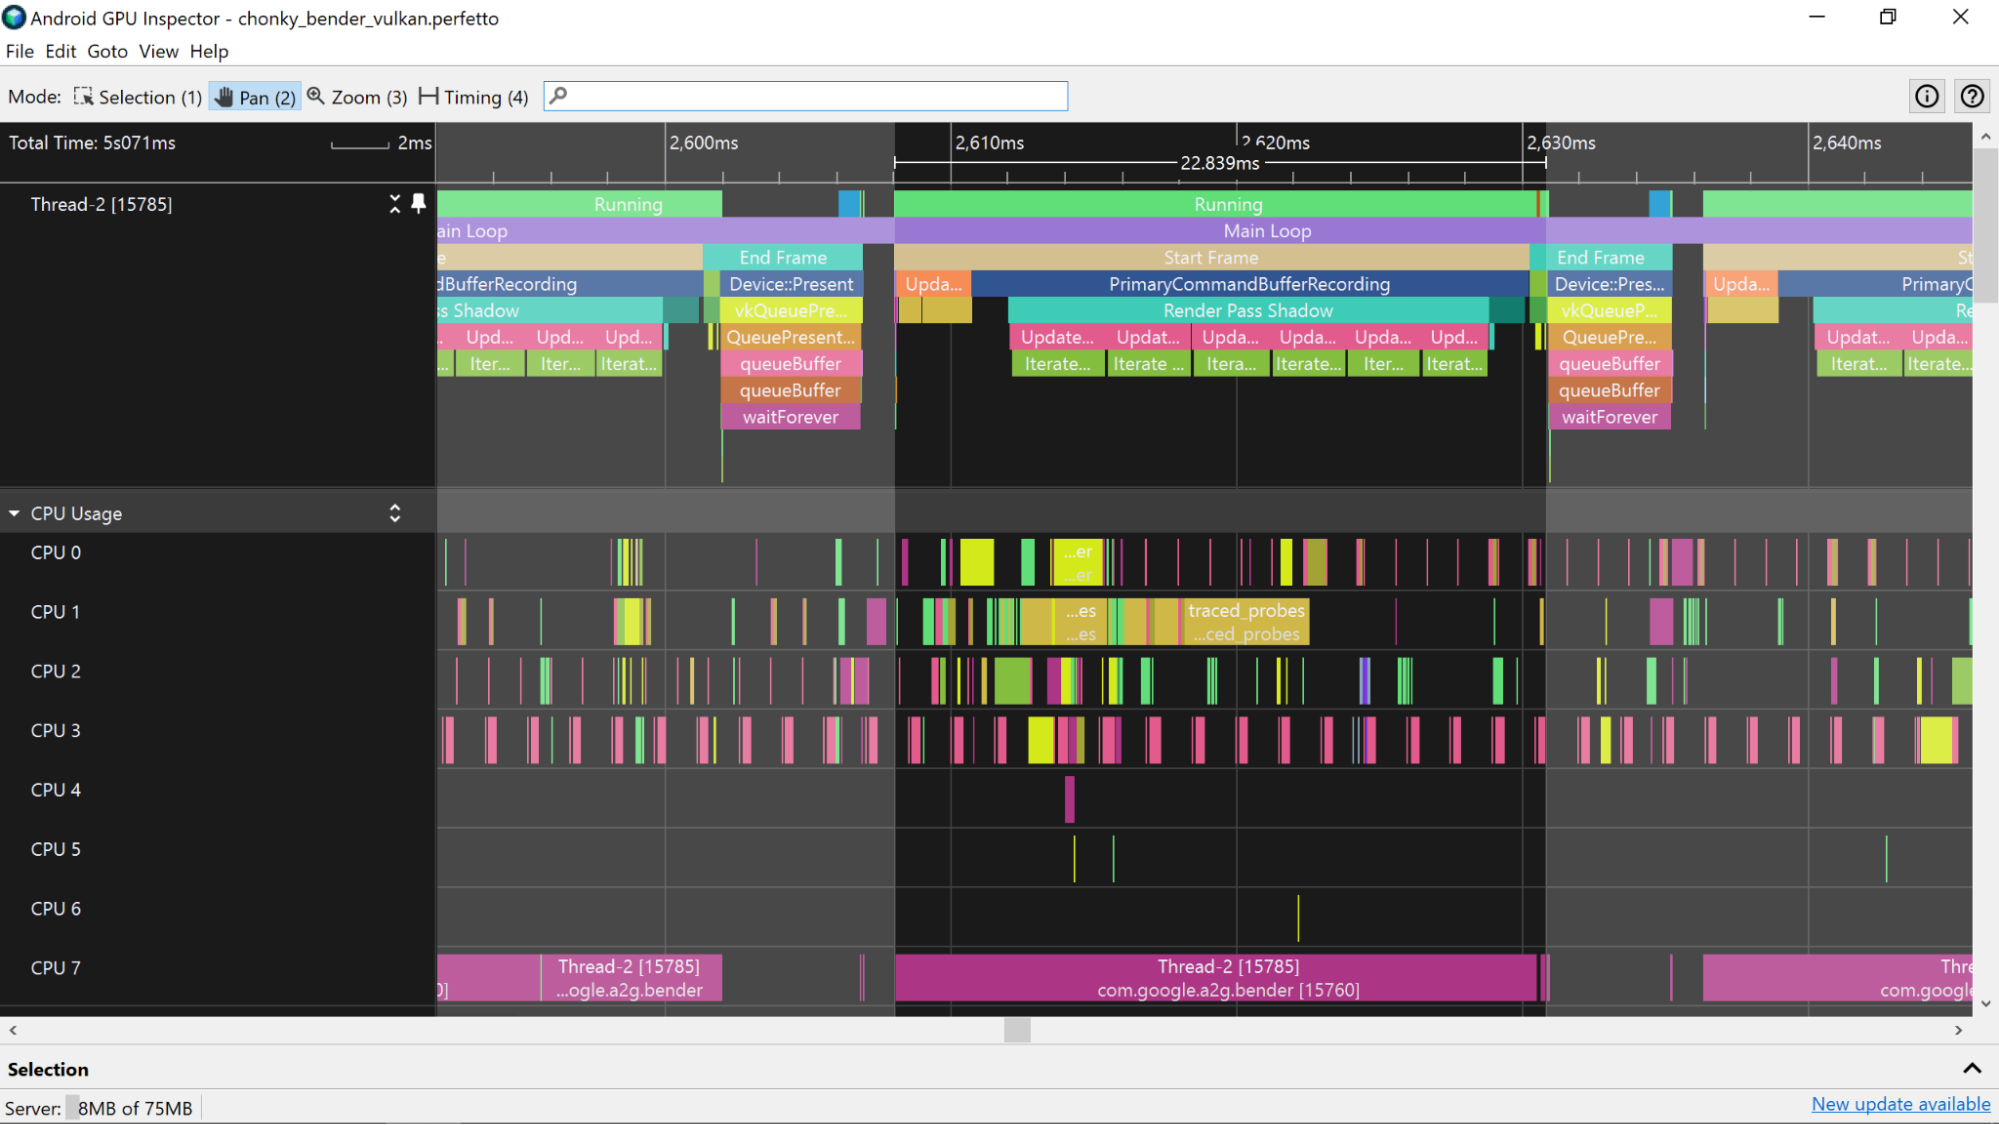
为帮助识别应用切片,您可以在应用中添加 ATrace 标记。这将在系统分析器的 CPU 轨迹中显示这些标记。
估算 GPU 帧时间
要估算 GPU 帧时间,您可以使用系统分析器中的 GPU 切片或 GPU 计数器。使用 GPU 切片时,估算结果更准确。
GPU 切片
如果系统分析器提供 GPU 切片信息,您可以衡量应用在与单个帧相关的任务上花费的总时间,从而获取非常准确的 GPU 帧时间信息。
Mali 设备
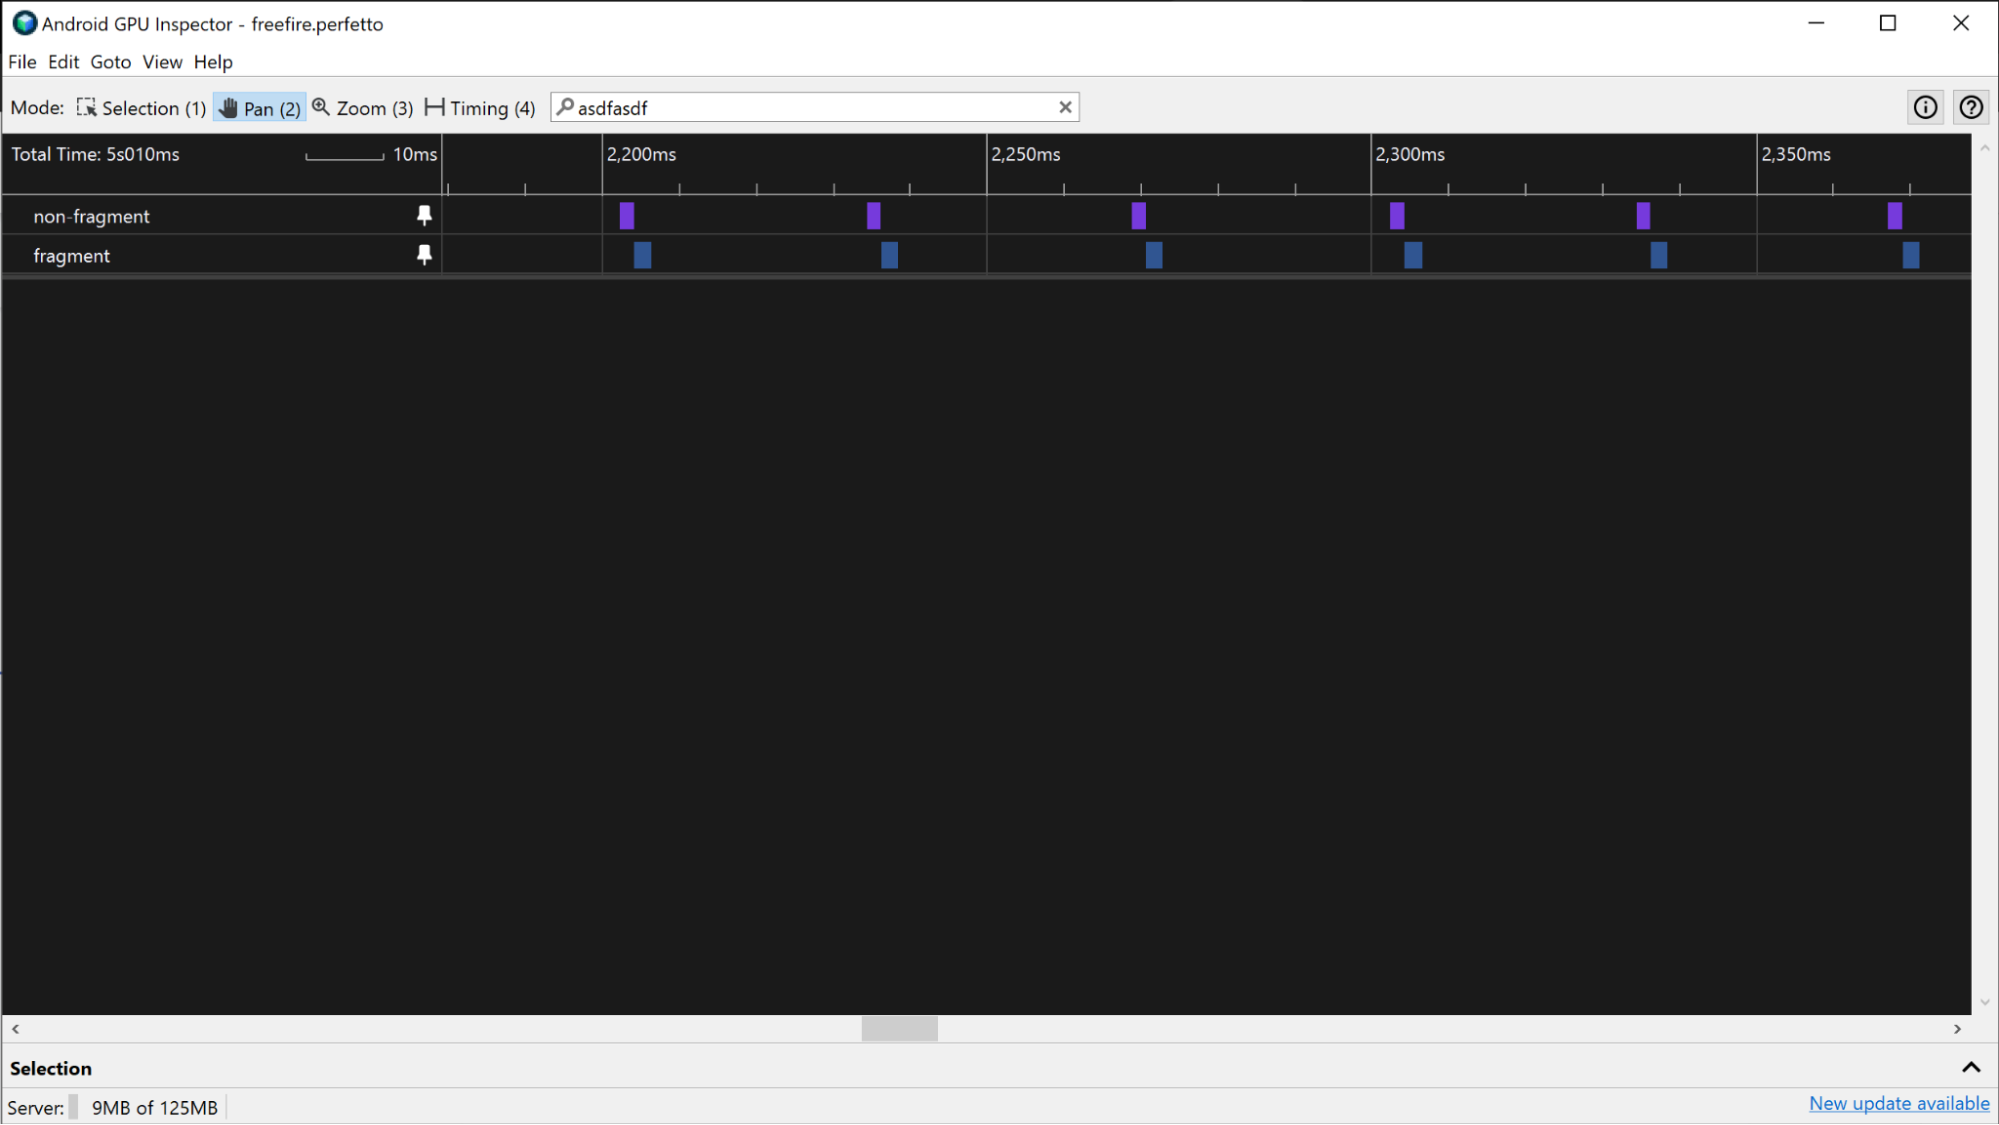
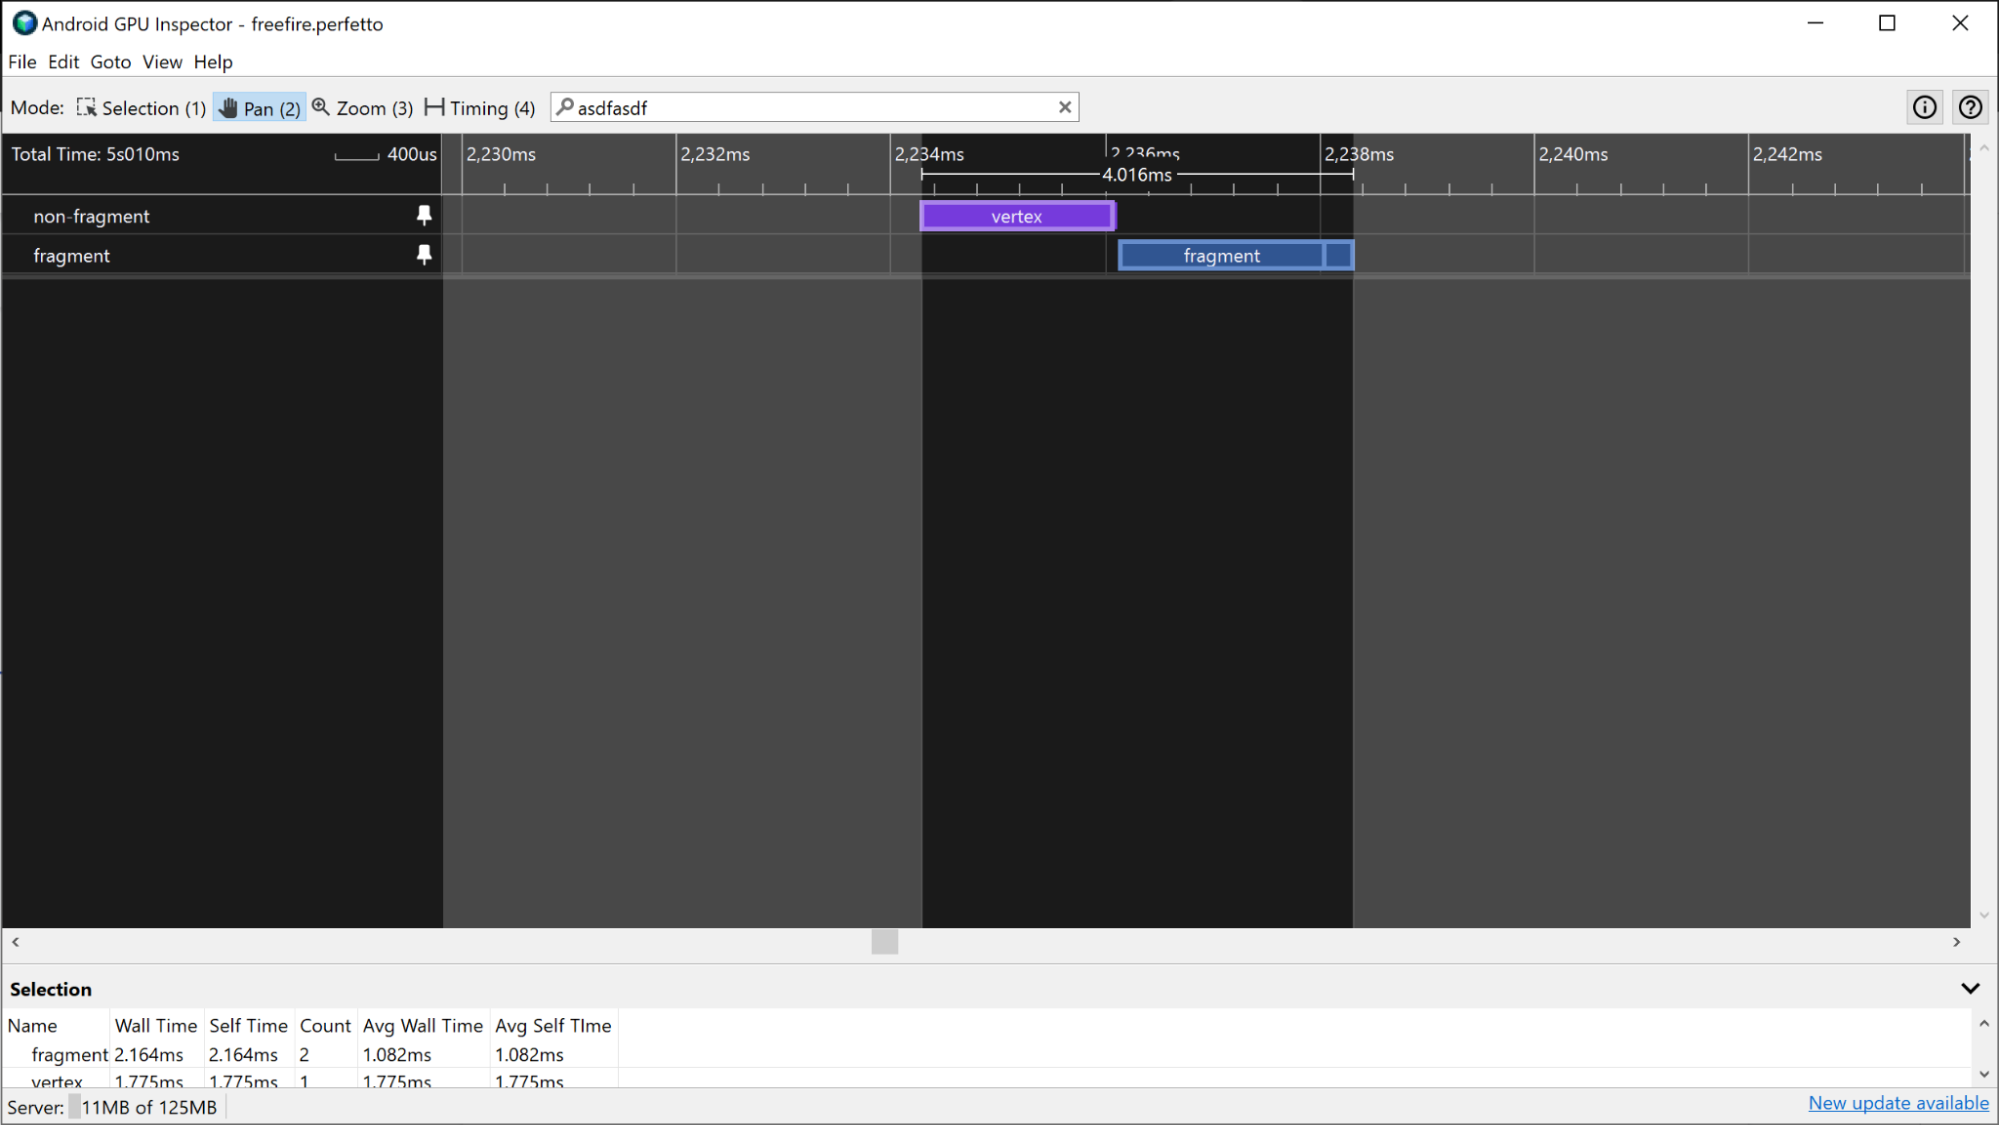
在 Mali 设备上,GPU 切片具有“片元”、“非片元”以及偶尔出现的“补充非片元”轨迹。对于复杂程度较低的帧,片元和非片元工作是顺序的,因此可以通过寻找活跃 GPU 工作之间的间隙来区分不同帧的工作。
作为替代方案,如果您熟悉提交给 GPU 的工作,识别已提交渲染通道的模式可提供有关帧何时开始和结束的信息。
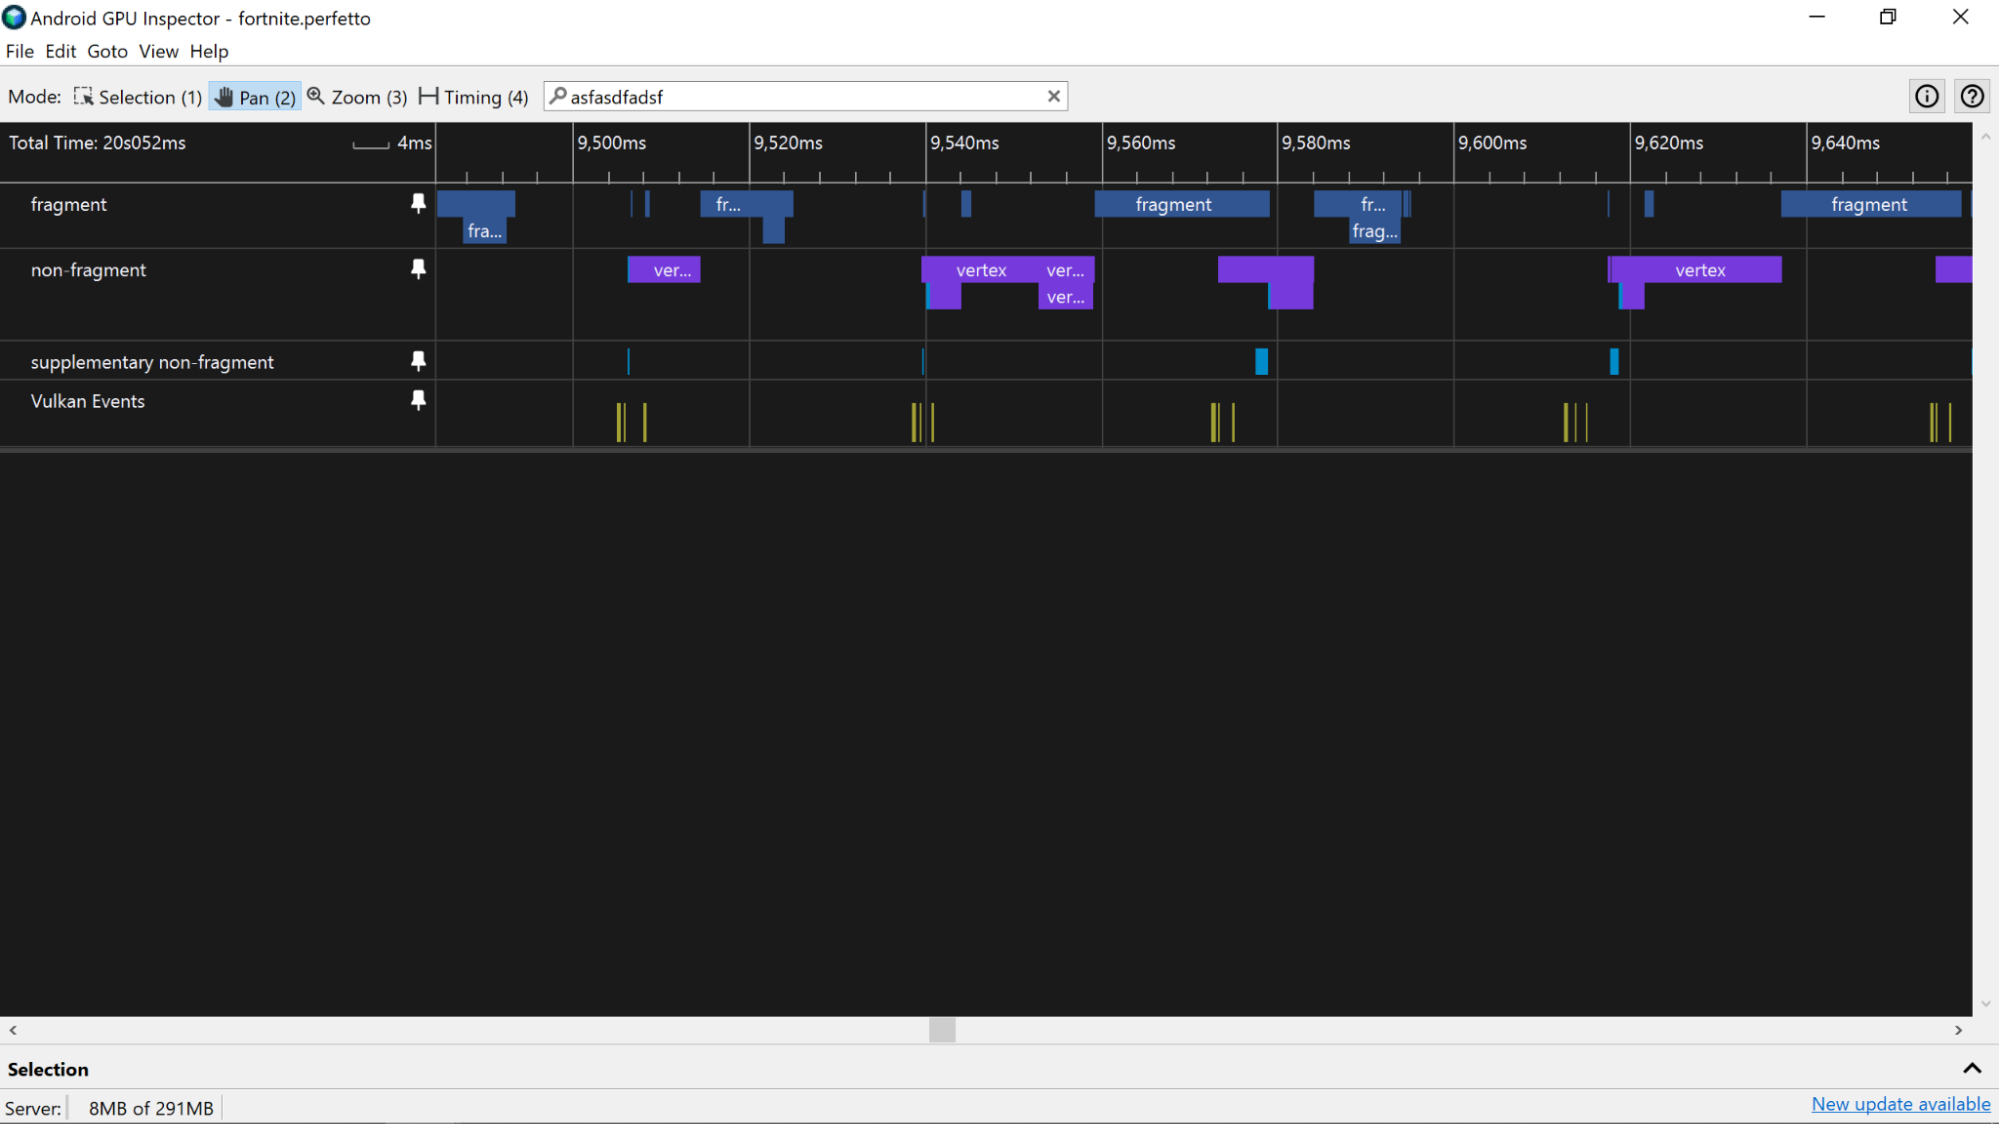
对于具有高度并行化 GPU 工作流程的应用,您可以通过查找每个切片中“选择”窗格中具有相同 submissionID 的所有帧来获取 GPU 帧时间。
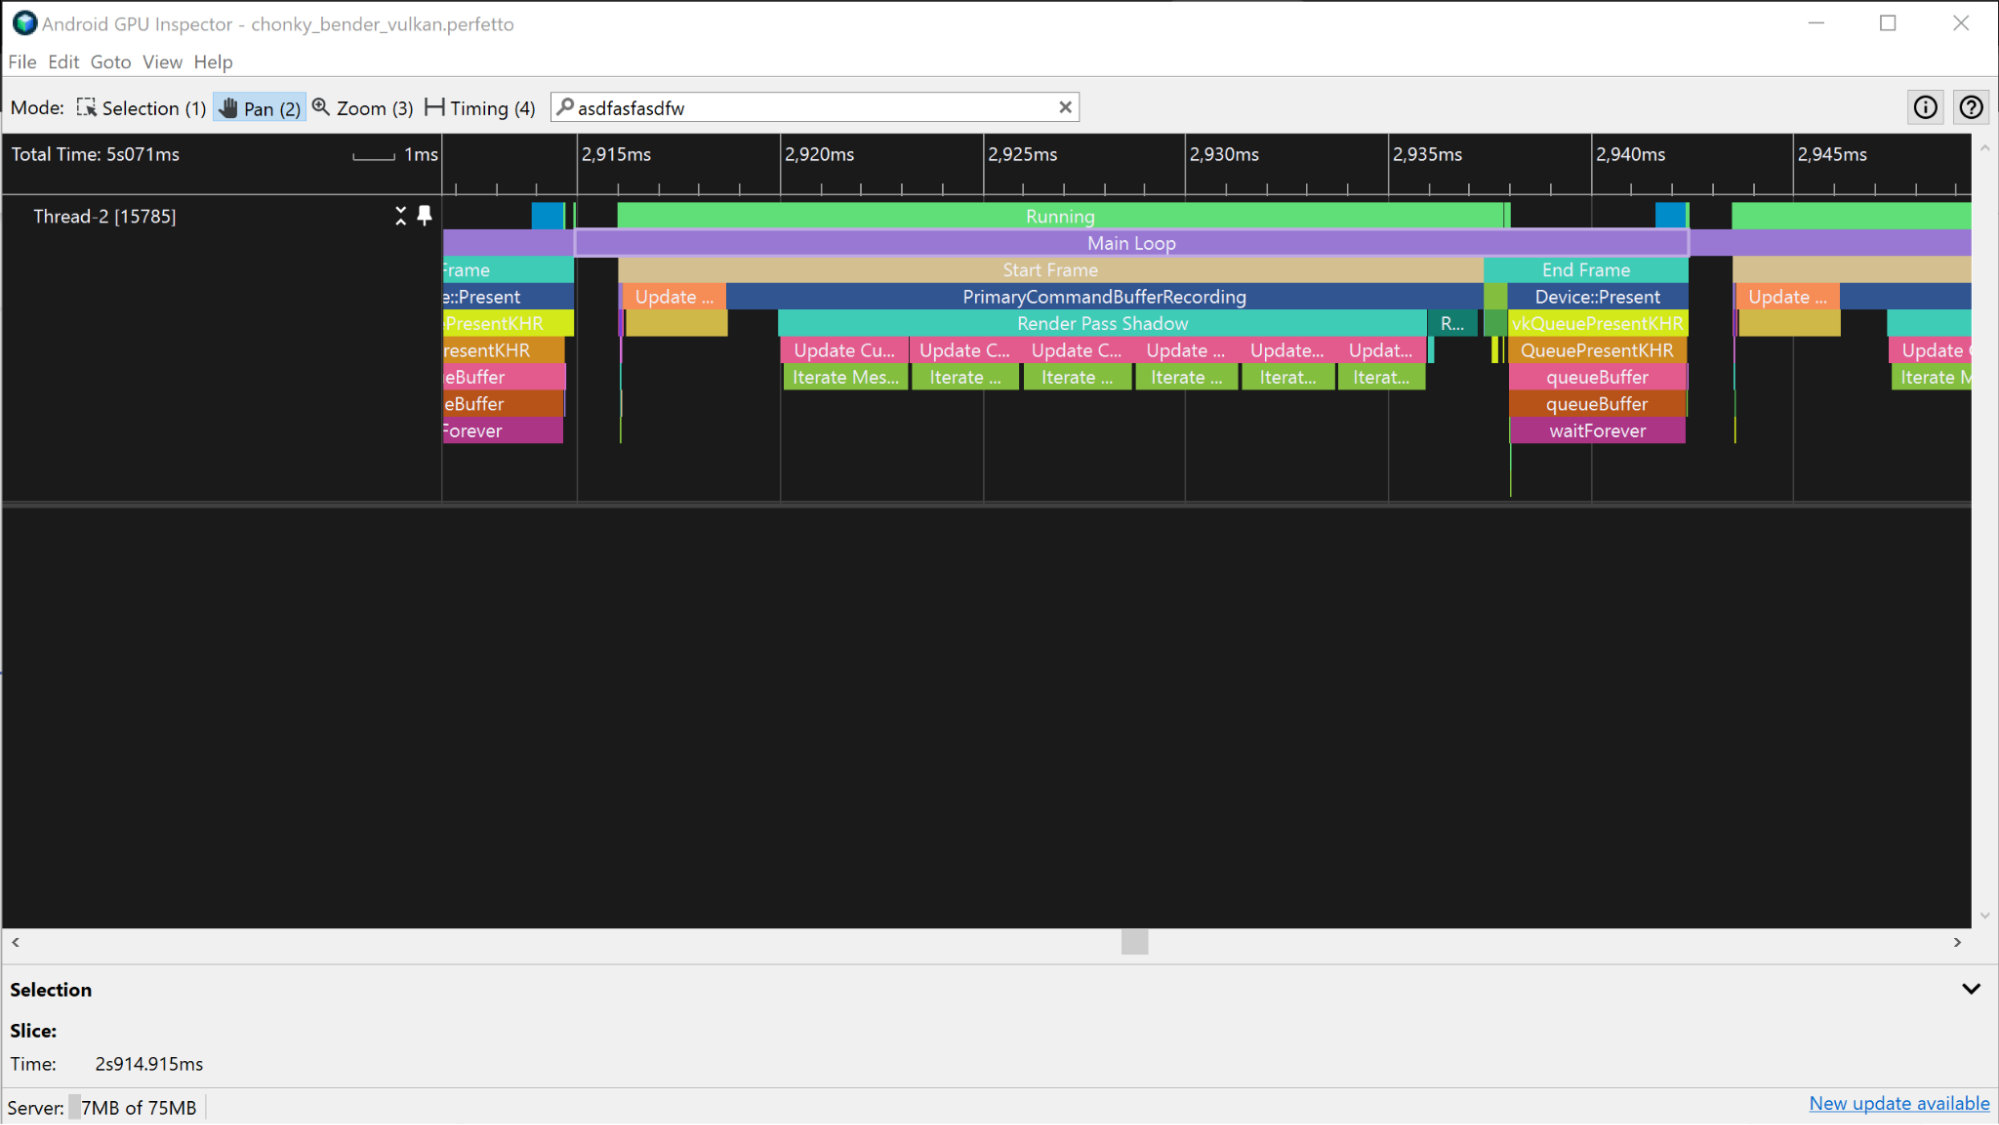
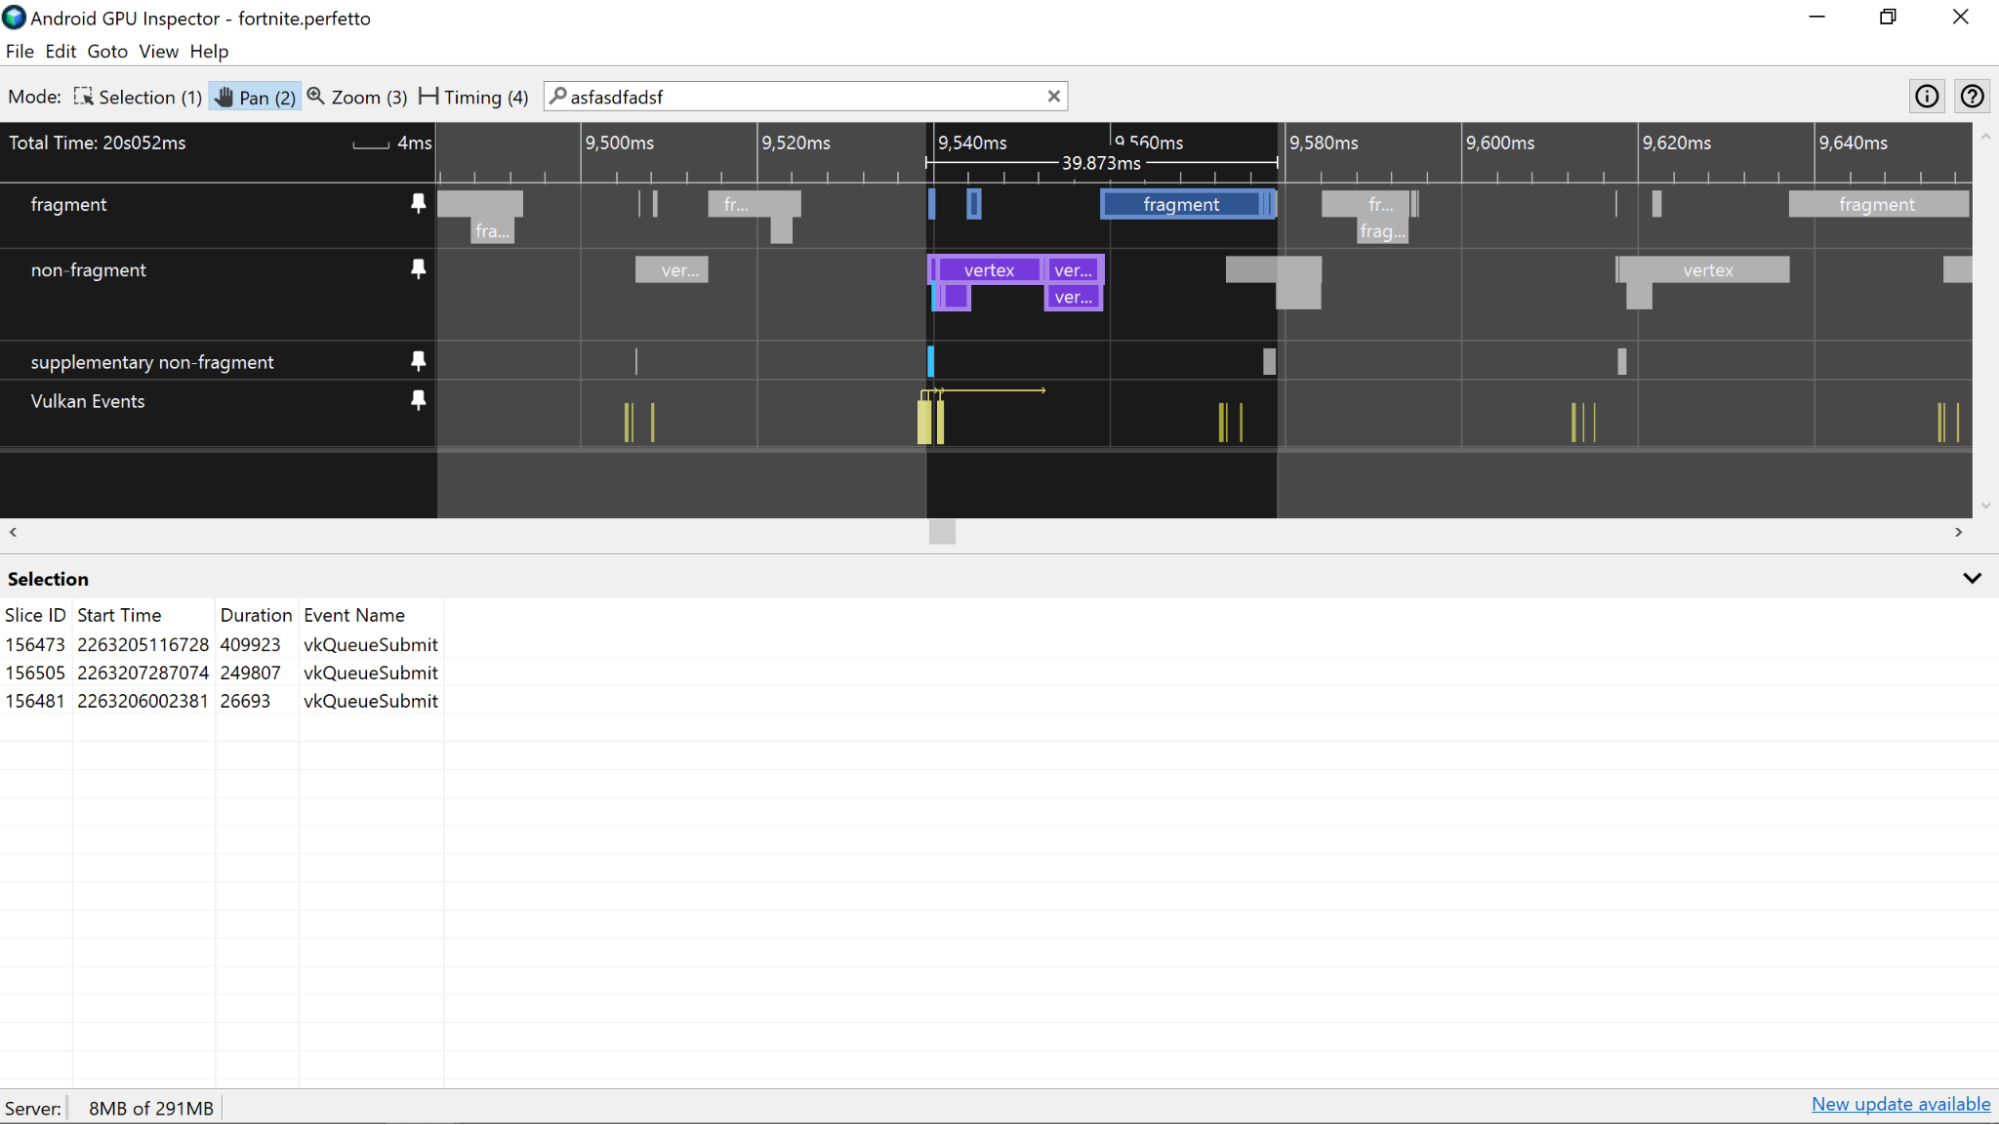
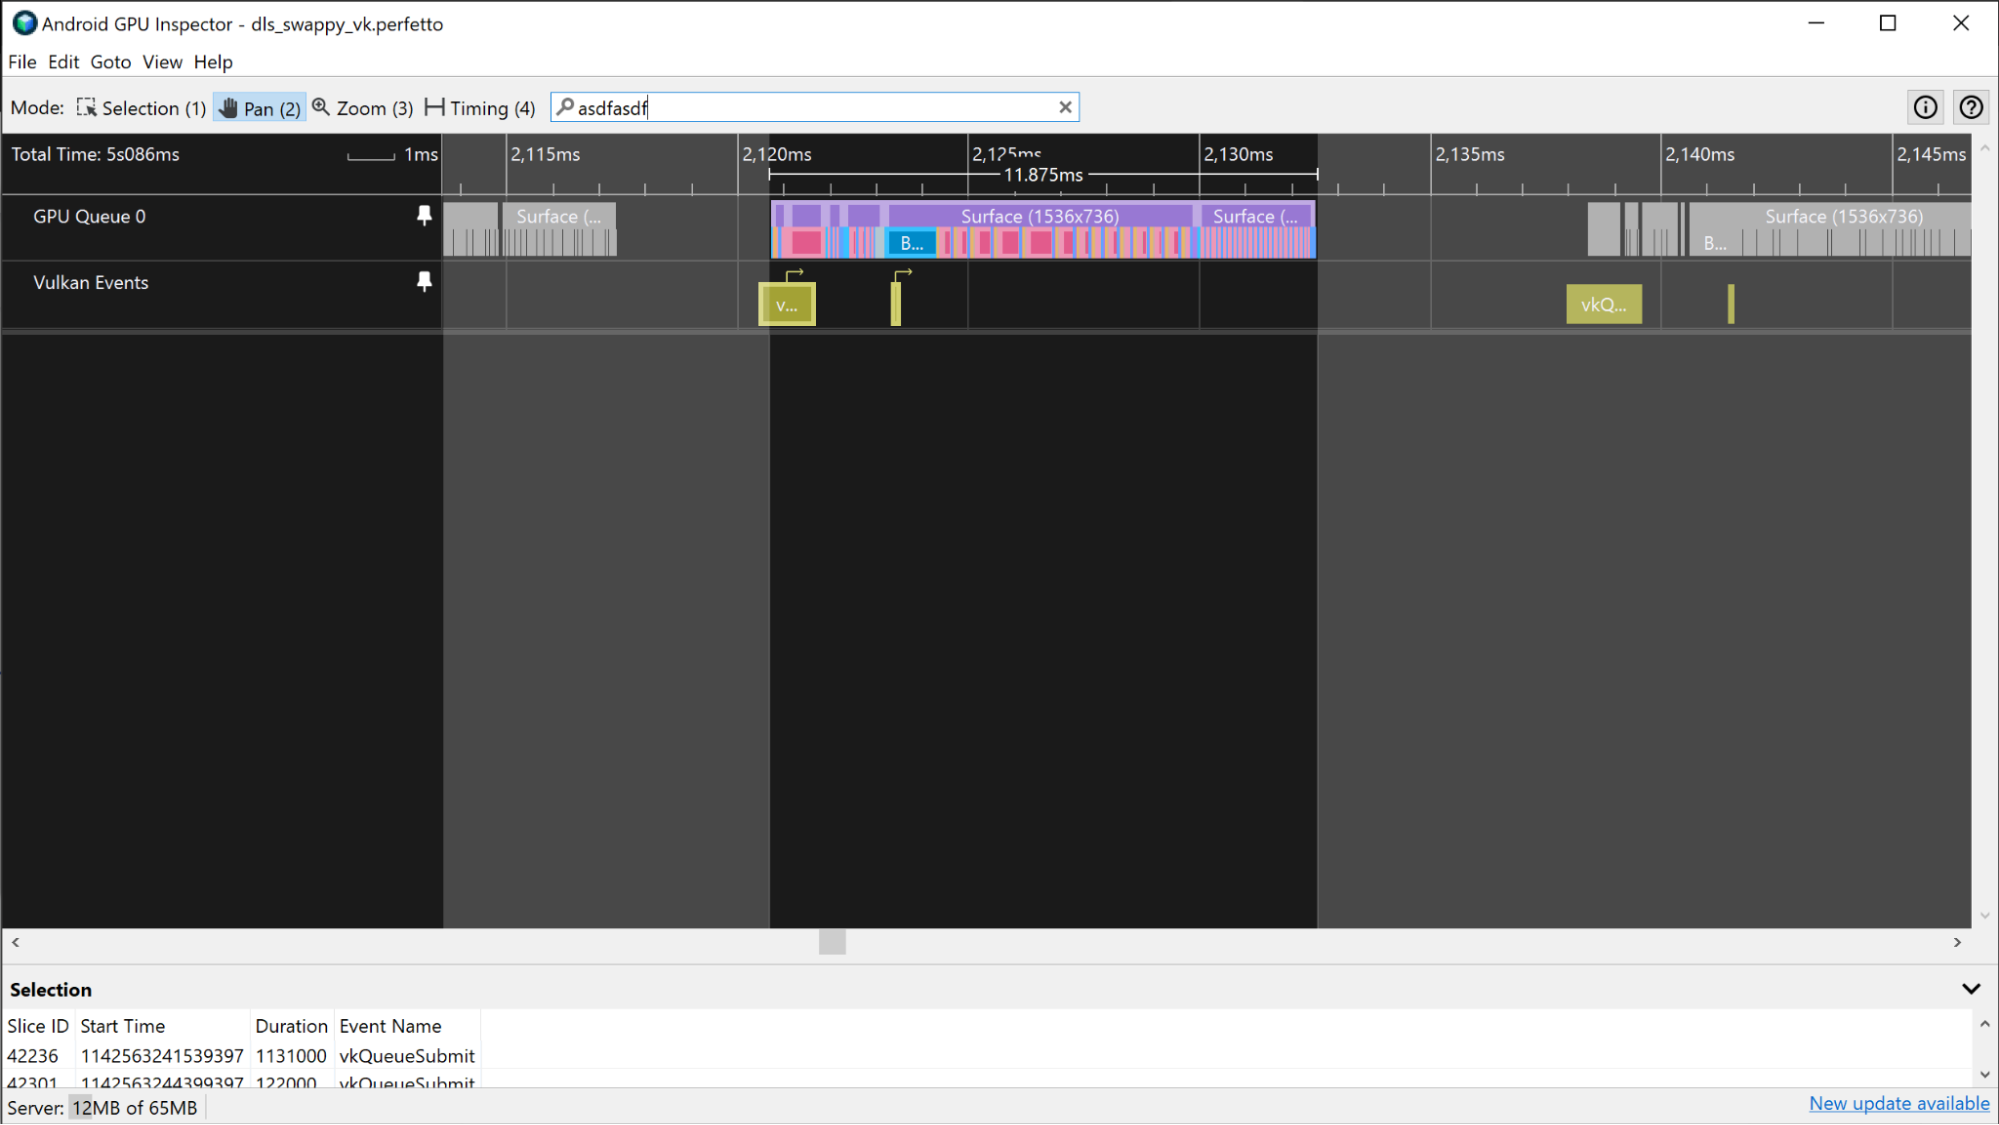
对于基于 Vulkan 的应用,可以使用多个提交来组成一个帧。通过使用“Vulkan 事件”轨迹(其中包含每个提交的切片)来跟踪提交 ID。选择一个提交切片将突出显示与该提交对应的所有 GPU 活动切片。
Adreno 设备
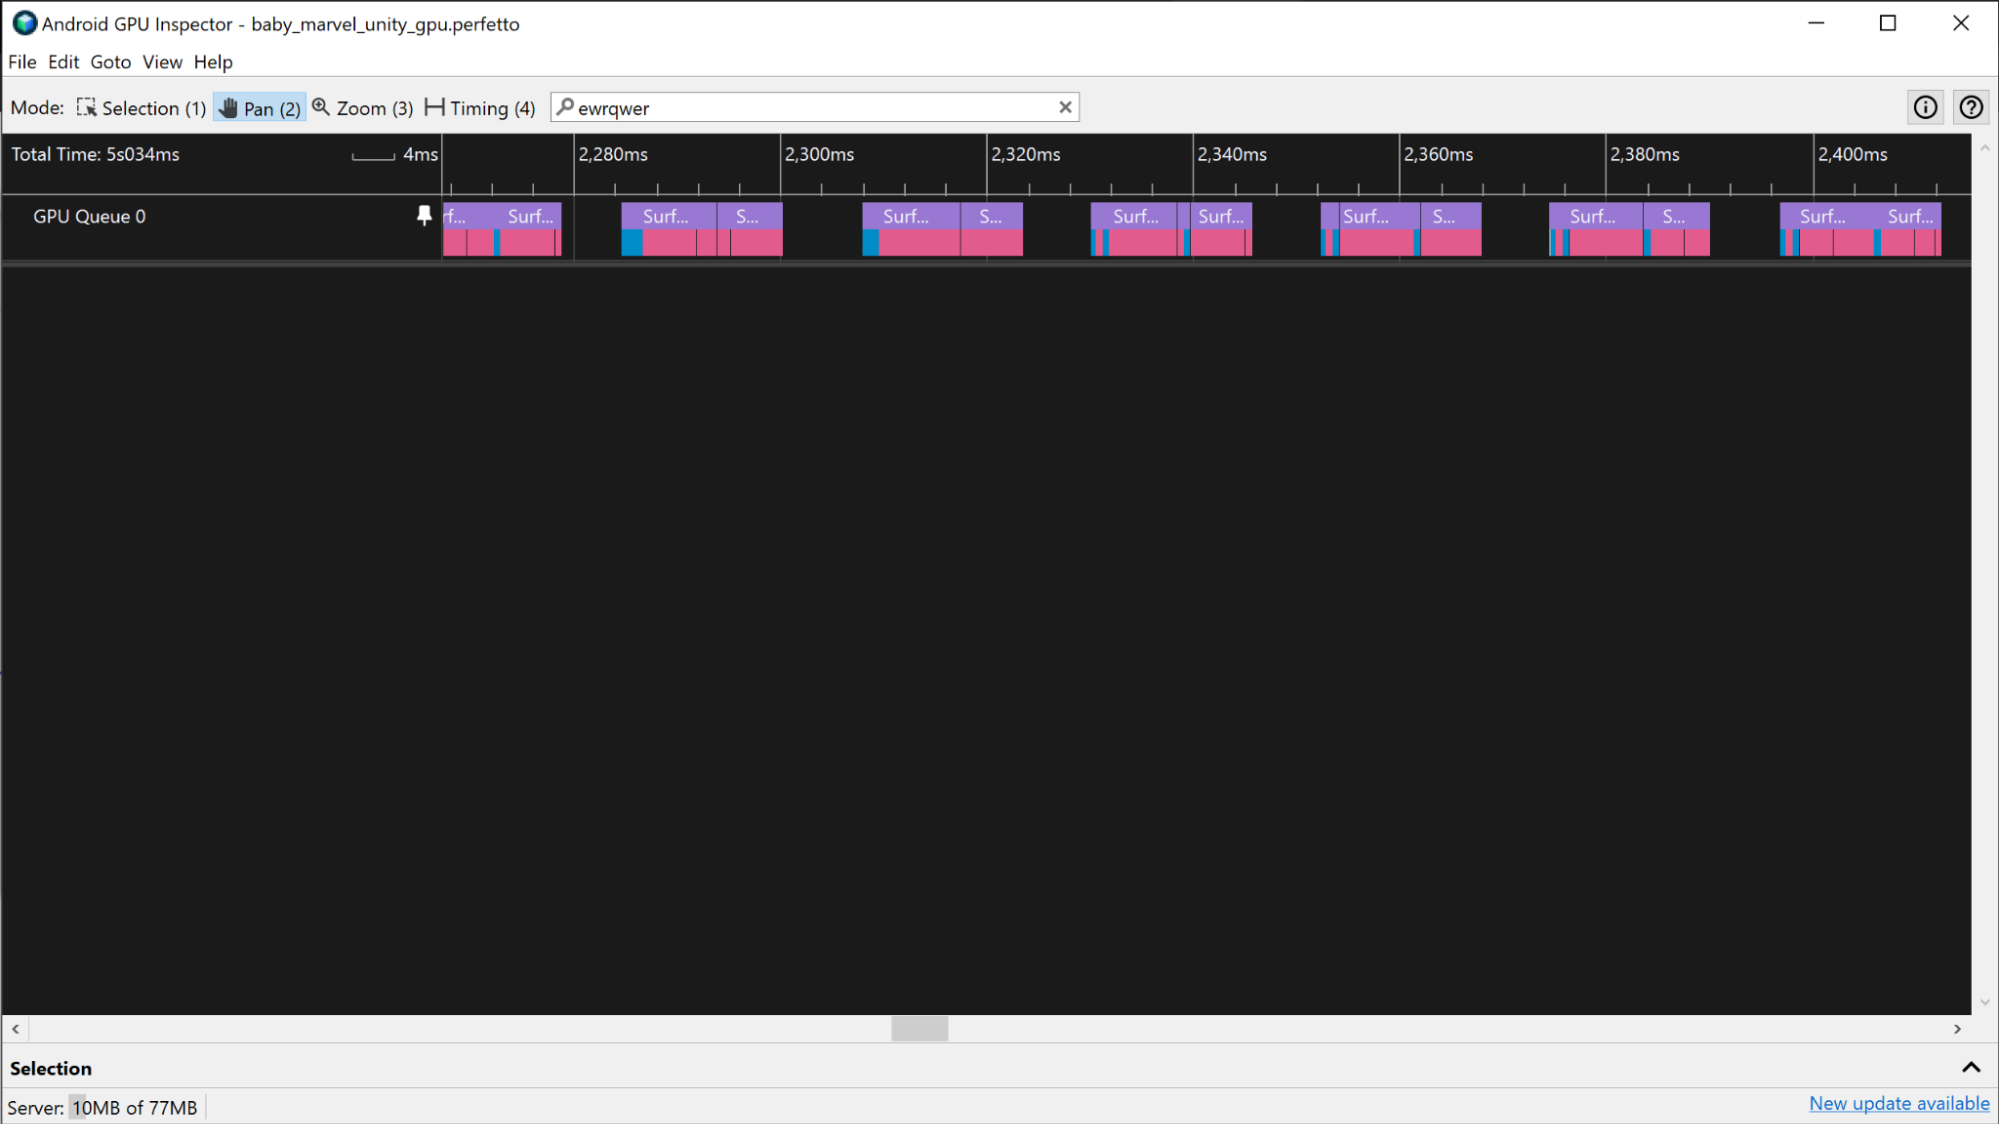
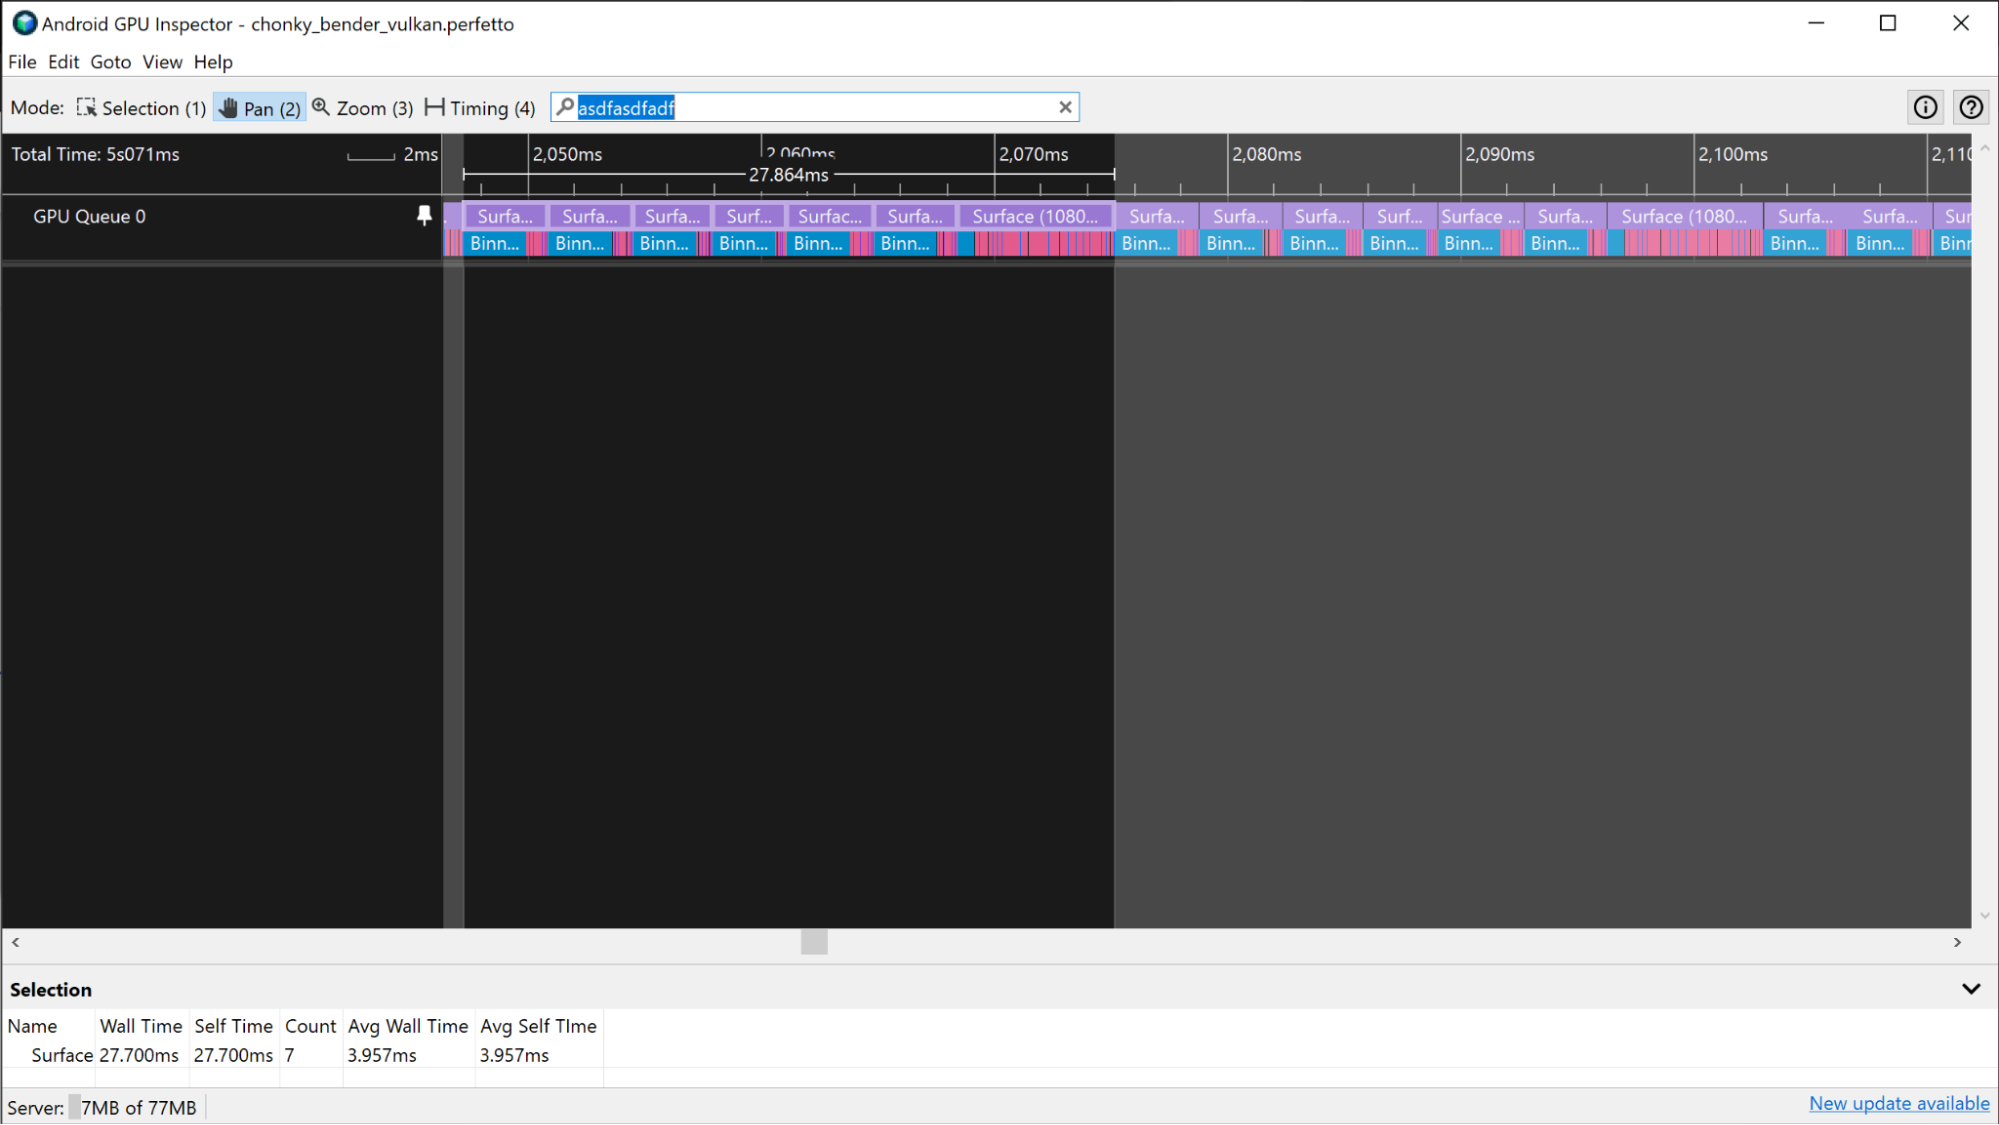
在 Adreno 设备上,GPU 切片会显示在“GPU 队列 0”轨迹中,并且始终按顺序呈现,因此您可以查看代表帧的渲染通道的所有切片,并使用它们来衡量 GPU 帧时间。
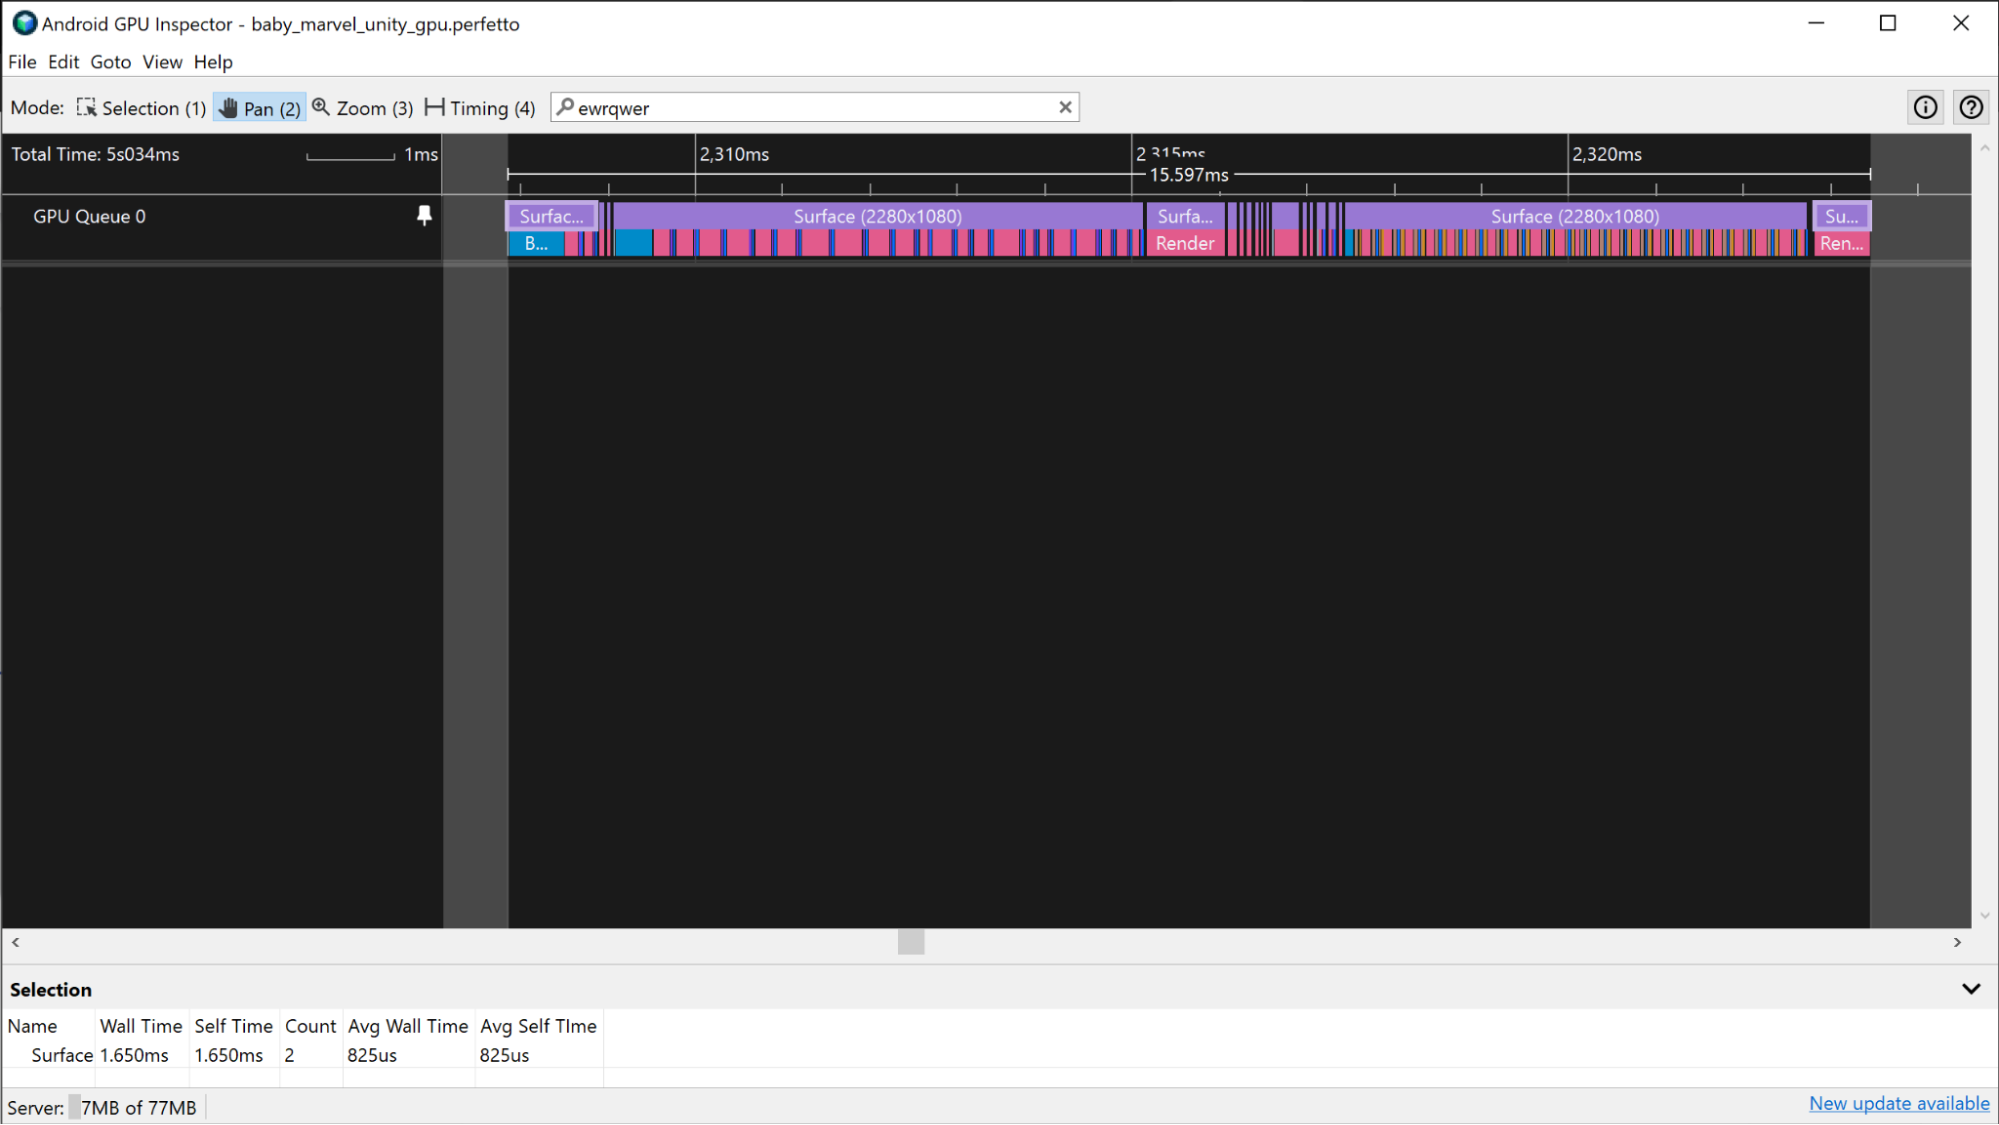
与前面描述的 Mali 场景类似:如果应用使用 Vulkan,则“Vulkan 事件”轨迹会提供有关为执行帧而提交的工作的信息。要突出显示渲染通道,请点击与该帧关联的“Vulkan 事件”切片。
在某些情况下,由于应用严重受限于 GPU,GPU 帧边界更难以区分。在这些场景中,如果您熟悉提交给 GPU 的工作,则可以识别渲染通道的执行模式,并从该信息中确定帧边界。
GPU 计数器
如果跟踪中没有 GPU 切片信息,您可以使用“GPU 计数器”轨迹来估算 GPU 帧时间。
Mali 设备
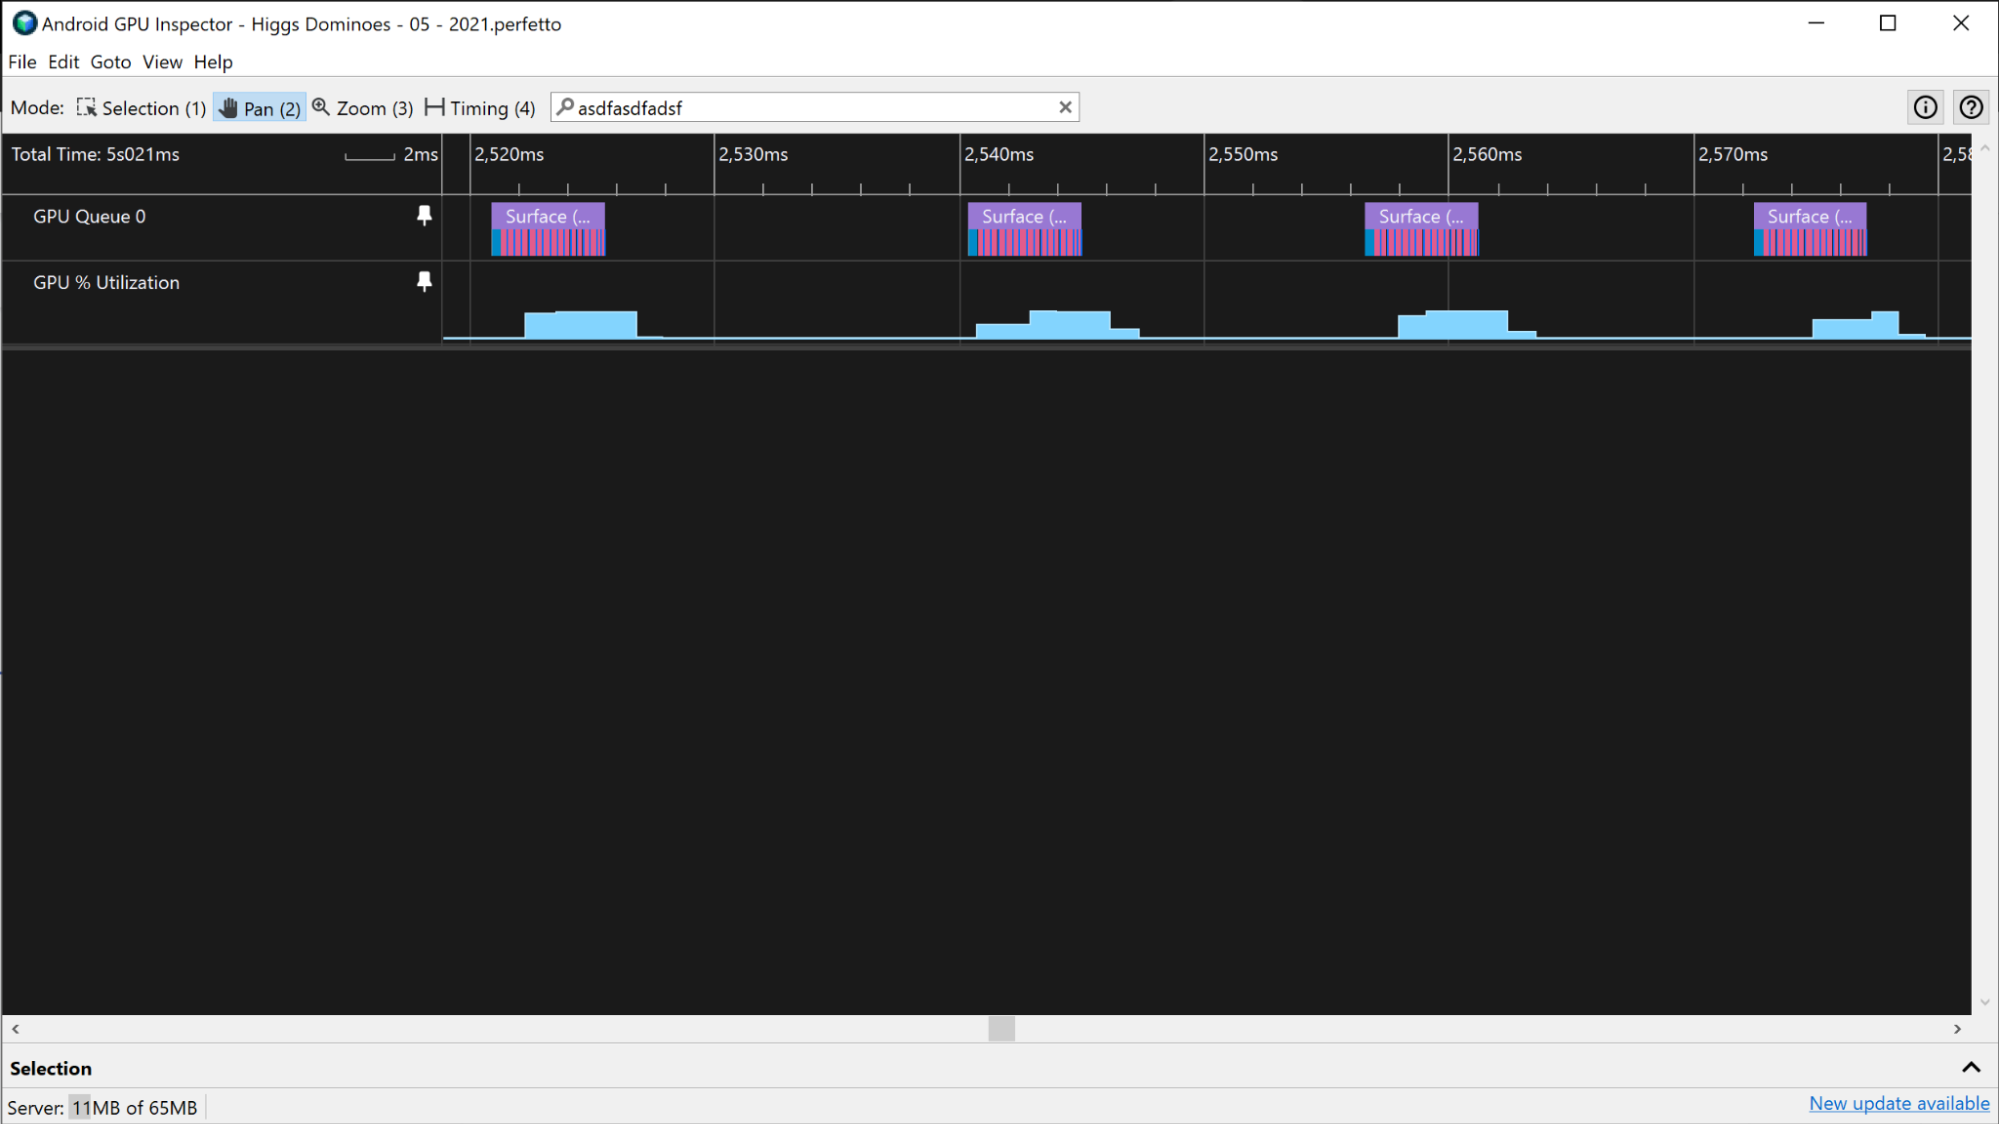
在 Mali 设备上,您可以使用“GPU 利用率”轨迹来估算非 GPU 密集型应用的 GPU 帧时间。当应用 GPU 密集度较低时,它们会定期出现高低 GPU 活动,而不是持续高活动。要使用“GPU 利用率”轨迹估算 GPU 帧时间,请衡量轨迹中高活动周期的持续时间。
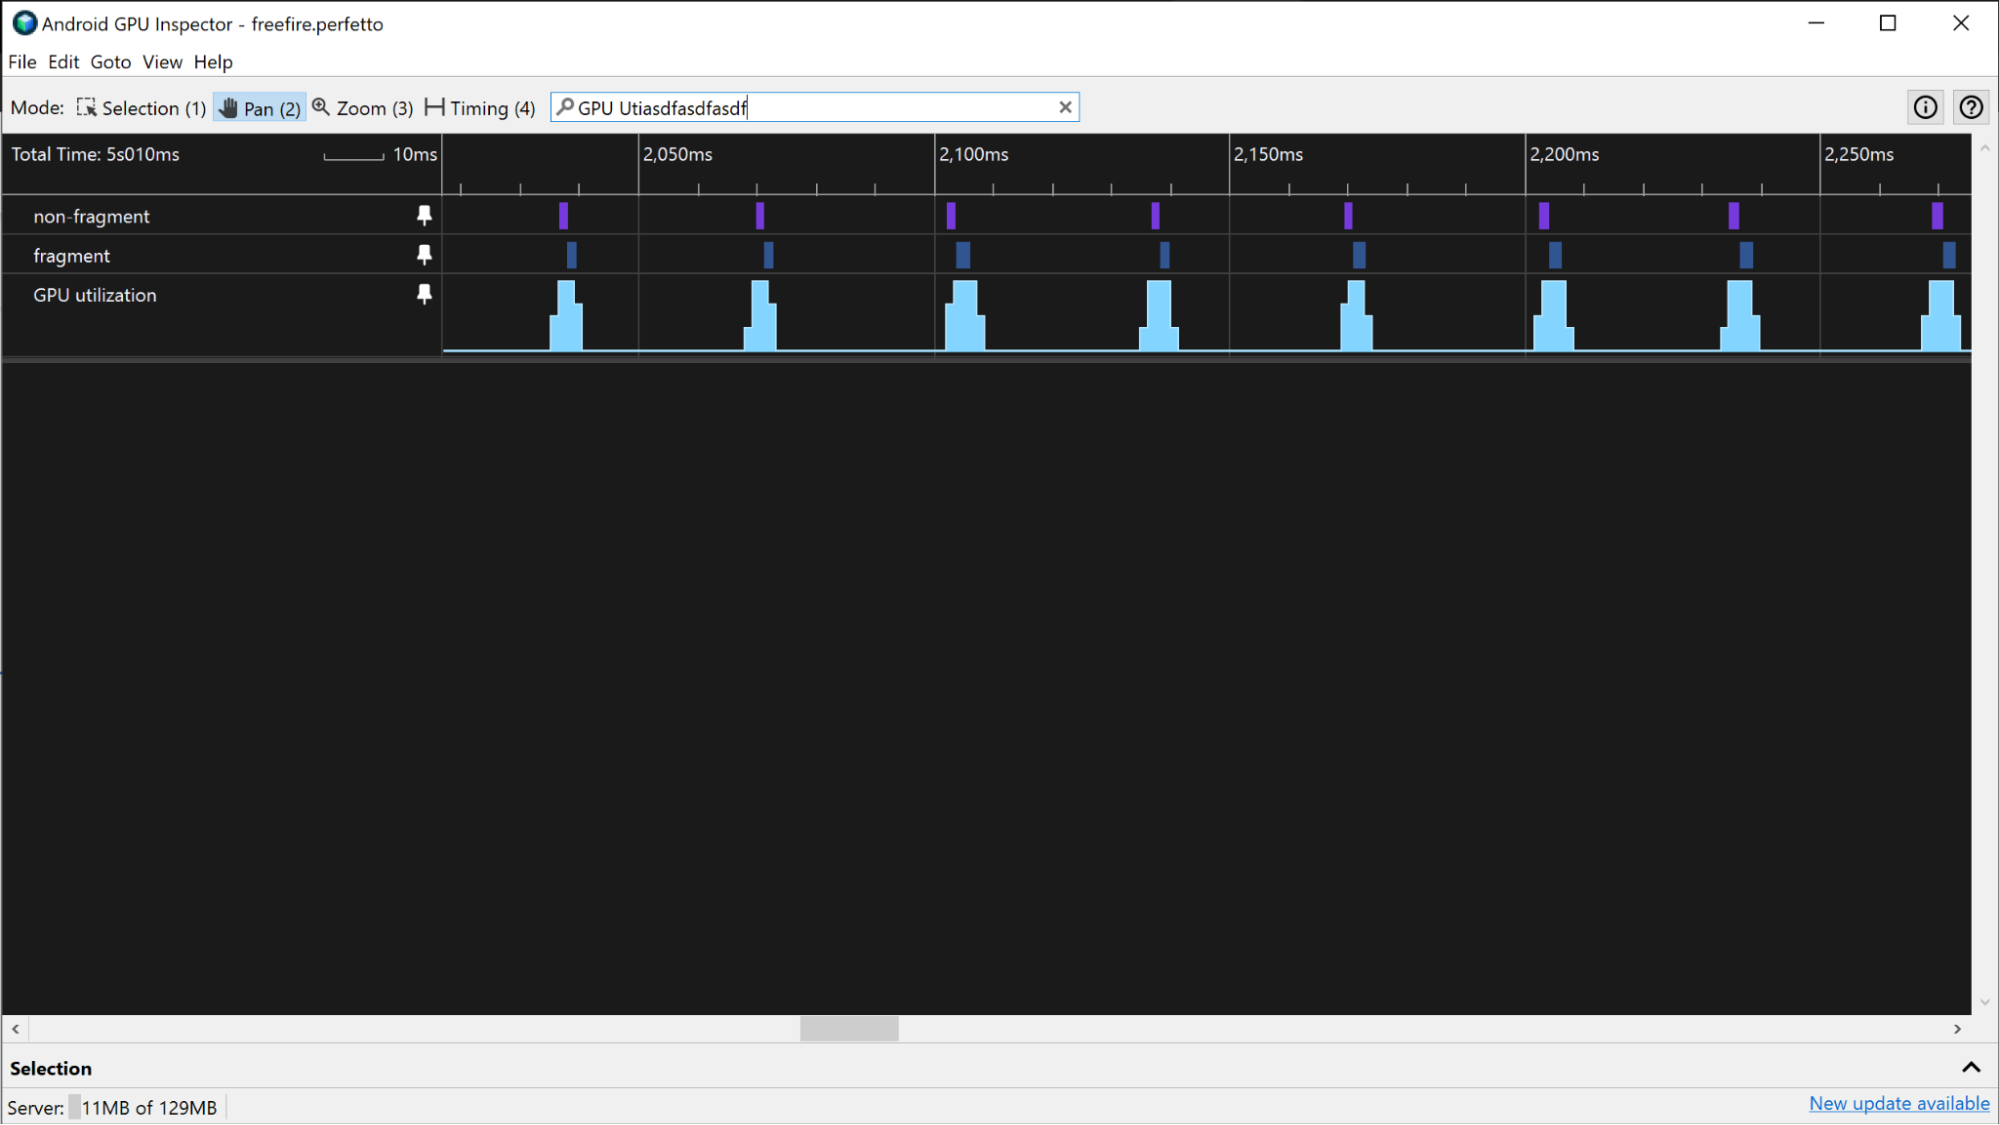
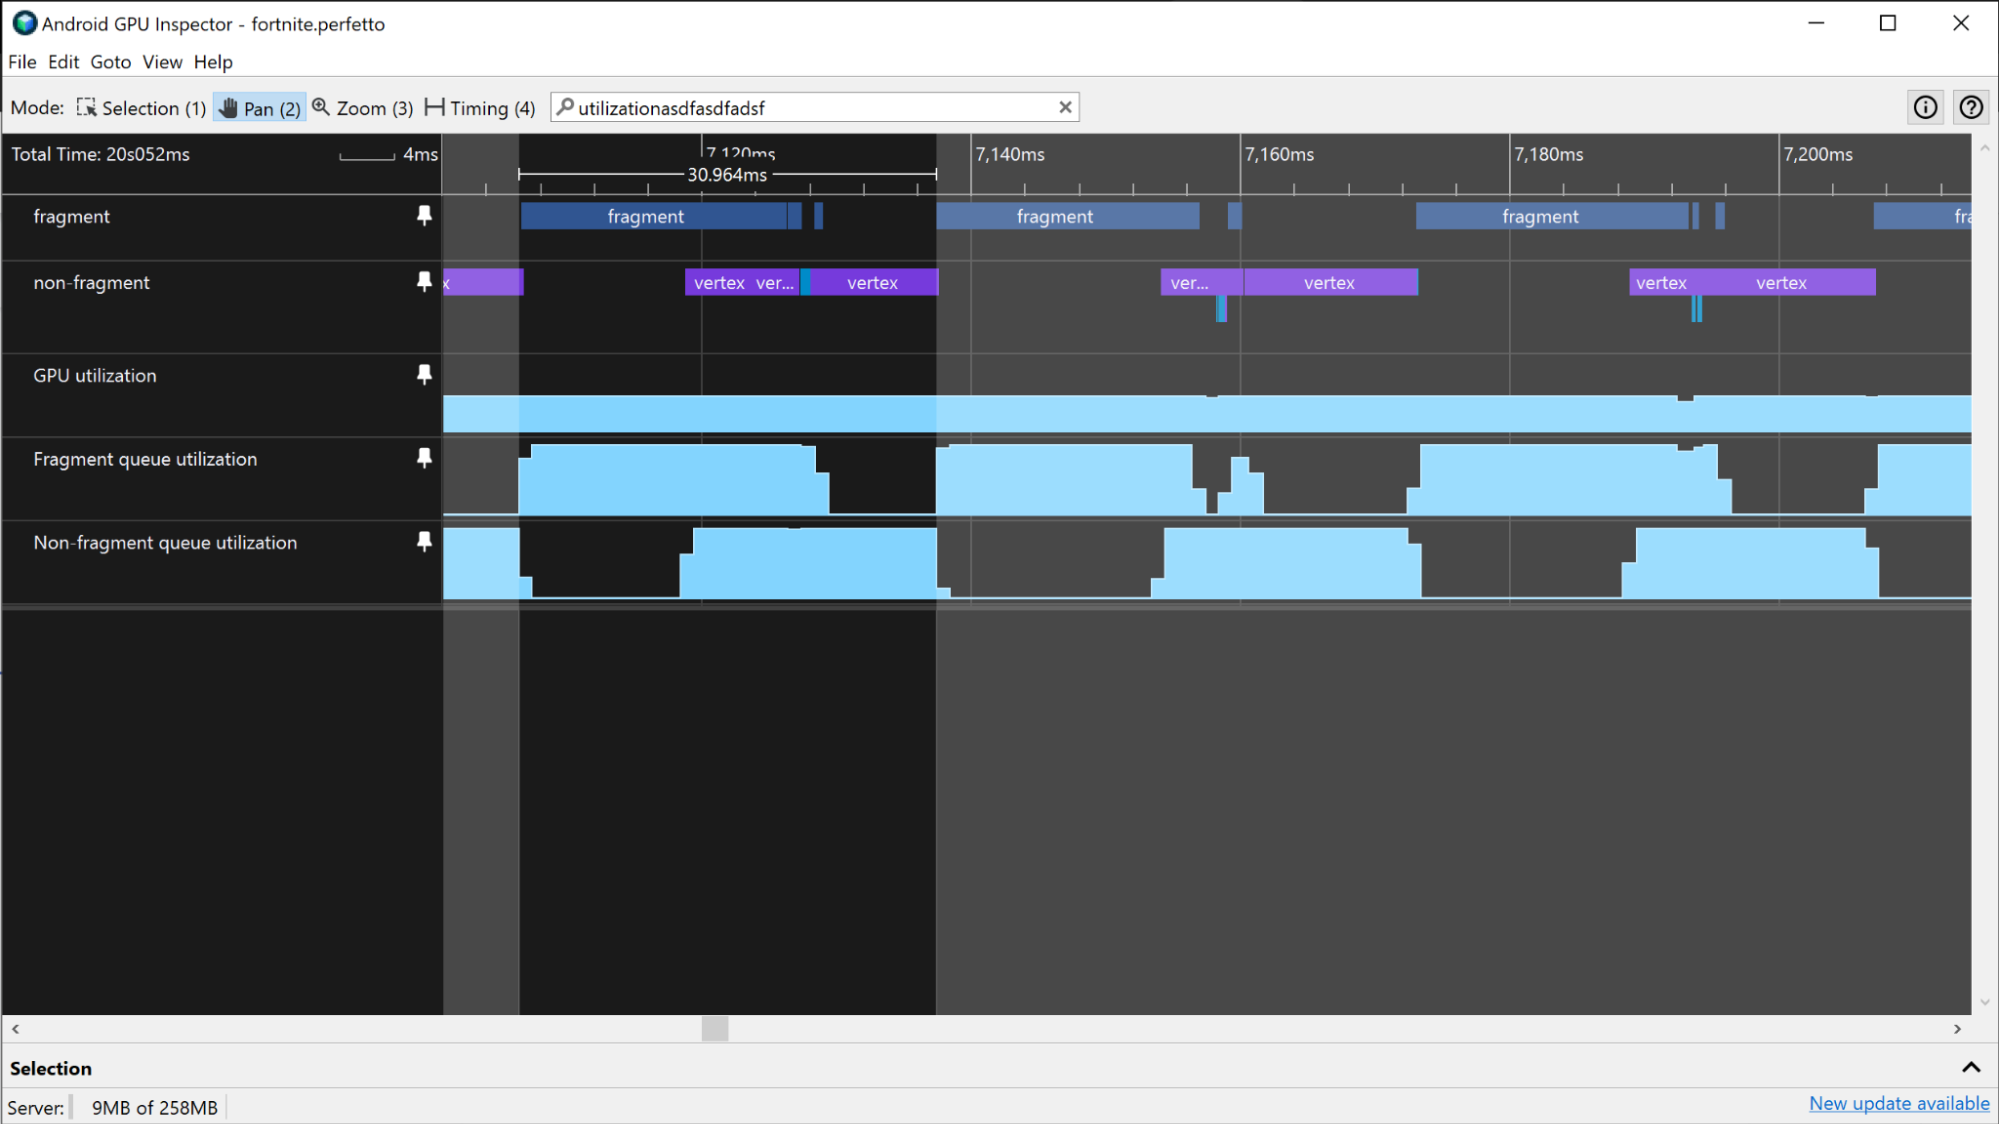
如果应用是 GPU 密集型应用,则 GPU 利用率可能持续非常高。在这种情况下,您可以使用“片元队列利用率”和“非片元队列利用率”轨迹来监控 GPU 活动并估算 GPU 帧时间。通过查看“片元”和“非片元”轨迹中的模式,您可以大致估算出帧的边界位置,并使用该信息衡量 GPU 帧时间。
Adreno 设备
在 Adreno 设备上,如果应用不是 GPU 密集型应用,您可以使用与上一部分中的Mali 设备相同的方式估算 GPU 帧时间。
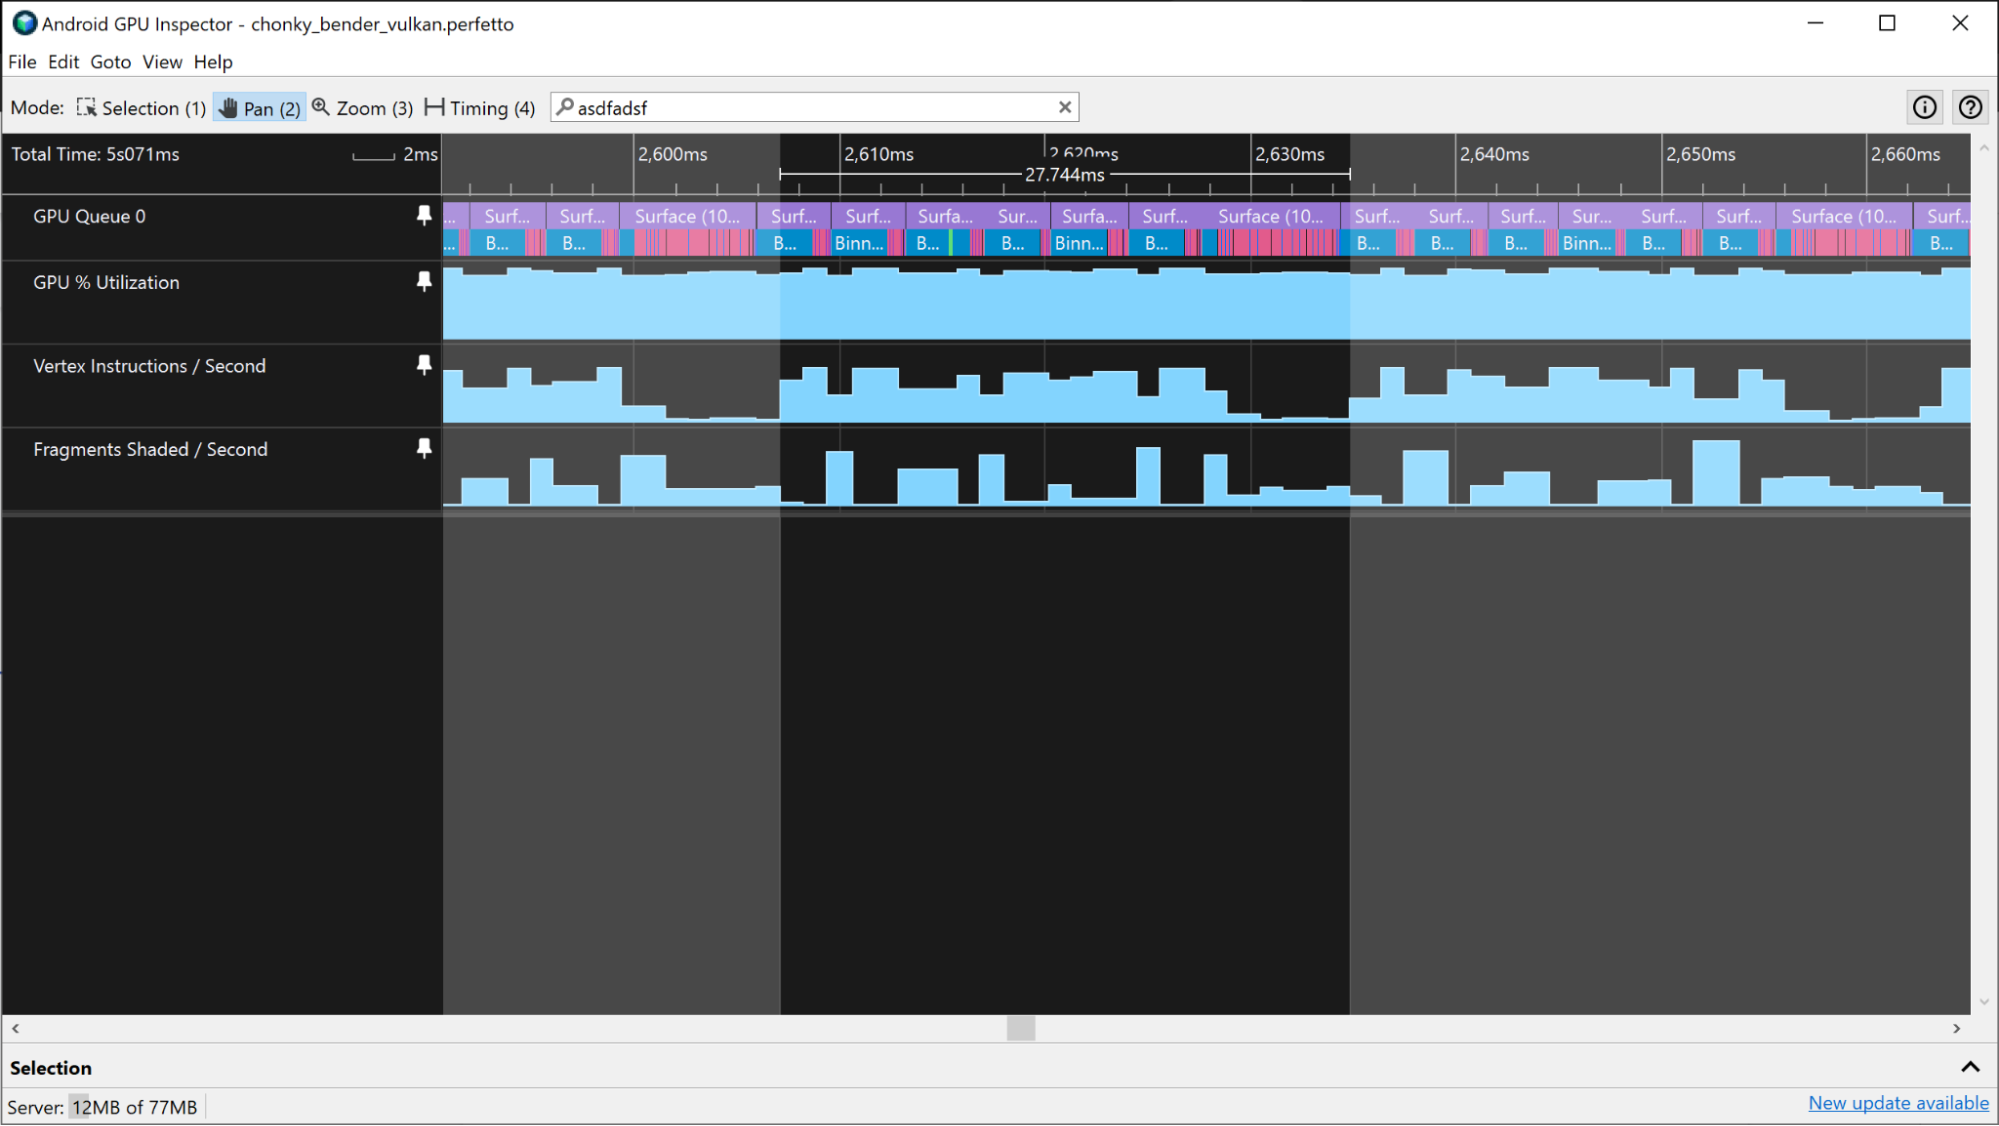
如果应用是 GPU 密集型应用,且应用的 GPU 利用率百分比持续很高,您可以使用“顶点指令/秒”和“片元指令/秒”轨迹来估算 GPU 帧时间。通过查看这些轨迹的活动水平中的模式,您可以大致估算出帧的边界位置,并使用该信息衡量 GPU 帧时间。
这些其他轨迹可能提供类似信息
- 每秒着色顶点数
- 每秒着色片元数
- 顶点着色时间百分比
- 片元着色时间百分比