
要生成应用执行的方法跟踪,您可以使用 Debug 类检测您的应用。通过这种方式检测您的应用,您可以更好地控制设备何时开始和停止记录跟踪信息。设备还会使用您指定的名称保存跟踪日志,以便您以后轻松识别每个日志。然后,您可以使用 Android Studio CPU Profiler 查看每个跟踪日志。
您也可以在不检测应用代码的情况下,在 CPU Profiler 中开始和停止跟踪。
在开始生成跟踪日志之前,请确保您的应用已添加将跟踪日志保存到其应用专用目录的逻辑。
检测您的应用
要创建跟踪日志,请在您希望系统开始记录跟踪数据的位置调用 startMethodTracing()。
在此调用中,您可以指定 .trace 文件的名称,系统会将其保存到目标设备上用于持久应用数据的包特定目录中——这与 getExternalFilesDir() 返回的目录相同,并且位于大多数设备上的 ~/sdcard/ 目录中。此文件包含二进制方法跟踪数据以及包含线程和方法名称的映射表。要停止跟踪,请调用 stopMethodTracing()。
以下示例开始和停止录制名为 sample.trace 的跟踪日志
Kotlin
// Starts recording a trace log with the name you provide. For example, the
// following code tells the system to start recording a .trace file to the
// device with the name "sample.trace".
Debug.startMethodTracing("sample")

// The system begins buffering the generated trace data, until your
// application calls <code><a href="/reference/android/os/Debug.html#stopMethodTracing()">stopMethodTracing()</a></code>, at which time it writes
// the buffered data to the output file.
Debug.stopMethodTracing()
Java
// Starts recording a trace log with the name you provide. For example, the
// following code tells the system to start recording a .trace file to the
// device with the name "sample.trace".
Debug.startMethodTracing("sample");
...
// The system begins buffering the generated trace data, until your
// application calls <code><a href="/reference/android/os/Debug.html#stopMethodTracing()">stopMethodTracing()</a></code>, at which time it writes
// the buffered data to the output file.
Debug.stopMethodTracing();
请注意,如果您的应用再次调用 startMethodTracing() 而未更改跟踪日志的名称,它将覆盖设备上已保存的现有日志。要了解如何动态更改每个跟踪日志的名称,请转到有关保存多个日志的部分。
如果系统在您调用 stopMethodTracing() 之前达到最大缓冲区大小,系统将停止跟踪并向控制台发送通知。启动和停止跟踪的方法适用于您的整个应用进程。也就是说,您可以在活动的 onCreate(Bundle) 方法中调用 startMethodTracing(),并在该活动的 onDestroy() 方法中调用 stopMethodTracing()。
请注意,启用分析时您的应用运行会更慢。也就是说,您不应使用分析数据来确定绝对时间(例如,“方法 foo() 需要 2.5 秒才能运行”)。跟踪日志中的时间信息仅在与先前的跟踪日志进行比较时才有用,这样您就可以查看最近的更改是使您的应用更快还是更慢。
部署到运行 Android 5.0(API 级别 21)及更高版本的设备时,您可以使用基于样本的分析来以较小的运行时性能影响进行分析。要启用样本分析,请调用 startMethodTracingSampling()(而不是调用 startMethodTracing())并指定采样间隔。系统会定期收集样本,直到您的应用调用 stopMethodTracing()。
保存多个日志
如果您的应用多次启动和停止方法跟踪而未为跟踪日志指定新名称,则设备将用新日志覆盖旧日志,即它只保留最新的跟踪日志。要将多个跟踪日志保存到您的设备,请在每次应用调用 startMethodTracing() 时动态重命名跟踪日志。下面的示例使用 SimpleDateFormat 类在命名每个跟踪日志时包含当前日期和时间
Kotlin
// Uses the <code><a href="/reference/java/text/SimpleDateFormat.html">SimpleDateFormat</a></code> class to create a String with
// the current date and time.
val dateFormat: DateFormat = SimpleDateFormat("dd_MM_yyyy_hh_mm_ss", Locale.getDefault())
val logDate: String = dateFormat.format(Date())
// Applies the date and time to the name of the trace log.
Debug.startMethodTracing("sample-$logDate")
Java
// Uses the <code><a href="/reference/java/text/SimpleDateFormat.html">SimpleDateFormat</a></code> class to create a String with
// the current date and time.
SimpleDateFormat dateFormat =
        new SimpleDateFormat("dd_MM_yyyy_hh_mm_ss", Locale.getDefault());
String logDate = dateFormat.format(new Date());
// Applies the date and time to the name of the trace log.
Debug.startMethodTracing(
        "sample-" + logDate);
访问设备上的跟踪日志
系统在您的设备上创建跟踪日志后,您可以通过以下任一方式访问该文件
使用设备文件浏览器。要打开设备文件浏览器,请点击 View > Tool Windows > Device Explorer(或点击工具窗口栏中的设备文件浏览器
 按钮)。如图 1 所示,您可以通过导航到应用包的特定目录来找到
 .trace文件。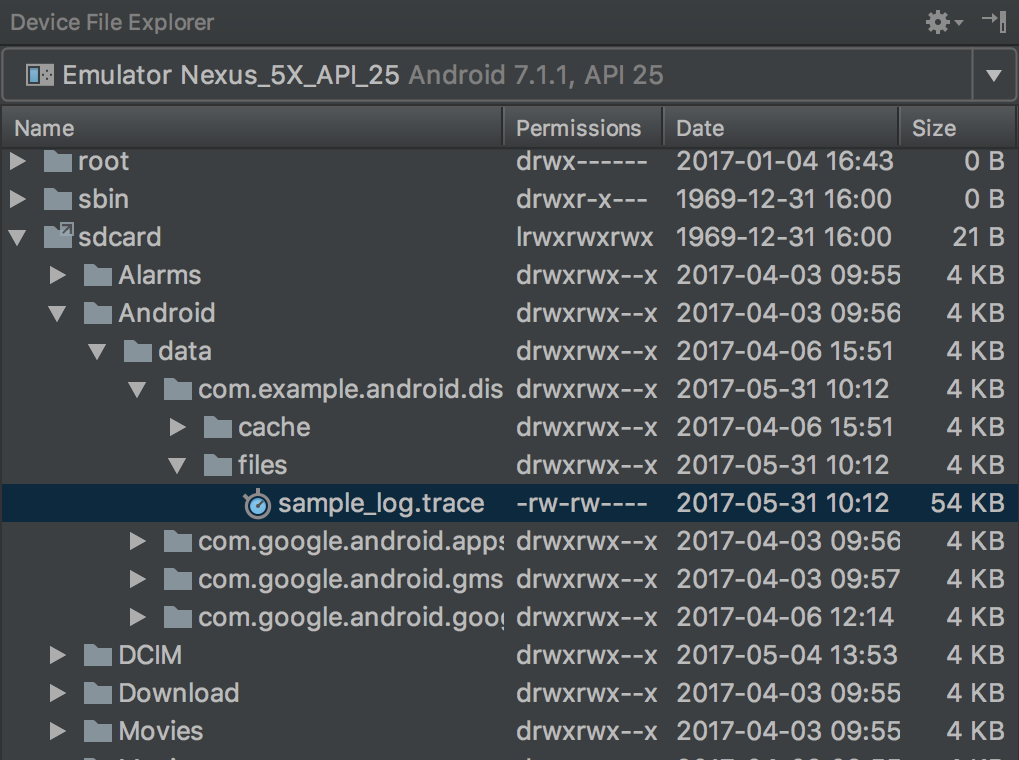
图 1. 使用设备文件浏览器定位跟踪日志。
使用
adb pull命令将文件复制到本地计算机。以下命令将名为sample.trace的跟踪日志从设备复制到本地计算机的~/Documents/trace-logs/目录。adb pull path-on-device/sample.trace ~/Documents/trace-logs/
然后,您可以使用 CPU Profiler 导入跟踪文件。